Ola Electric
Ride Analytics
Ola Electric
Ride Analytics
At-A-Glance
At-A-Glance
Ola Electric EV scooters come packed with various features and riding modes. Our data showed that a significant portion of users weren't utilising these capabilities fully. To address this, we developed a gamified ride analytics system that not only educates users about different features and modes but also provides detailed insights into their riding patterns and environmental impact.
Ola Electric EV scooters come packed with various features and riding modes. Our data showed that a significant portion of users weren't utilising these capabilities fully. To address this, we developed a gamified ride analytics system that not only educates users about different features and modes but also provides detailed insights into their riding patterns and environmental impact.
Ola Electric EV scooters come packed with various features and riding modes. Our data showed that a significant portion of users weren't utilising these capabilities fully. To address this, we developed a gamified ride analytics system that not only educates users about different features and modes but also provides detailed insights into their riding patterns and environmental impact.
Team Project
Team Project
Sanket G.
Unmesh G.
Raghavendra ST.
Sanket G.
Unmesh G.
Raghavendra ST.
Role
Role
Product Designer
3D Visual Designer
Product Designer
3D Visual Designer
Tools
Tools
Figma
Cinema4D
Figma
Cinema4D
Timeline
Timeline
April 2023 -June 2023
April 2023 -June 2023
The Problem
The Problem
Low Feature Discovery
Underutilised Features
Lack of Actionable Insights
Suboptimal UX
Community Building
Low Feature Discovery
Low Feature Discovery
Underutilised Features
Underutilised Features
Lack of Actionable Insights
Lack of Actionable Insights
Suboptimal UX
Suboptimal UX
Community Building
Community Building
“How can we increase feature discovery and
utilisation, while driving community engagement?”
“How can we increase feature discovery and utilisation, while driving community engagement?”
“How can we increase feature discovery and
utilisation, while driving community engagement?”
Many Ola Electric scooter users were unaware of or underutilising the various features and riding modes available to them. This lack of engagement with the scooter's full capabilities led to suboptimal user experiences and reduced the potential benefits of owning an electric scooter, such as energy efficiency and reduced environmental impact.
Many Ola Electric scooter users were unaware of or underutilising the various features and riding modes available to them. This lack of engagement with the scooter's full capabilities led to suboptimal user experiences and reduced the potential benefits of owning an electric scooter, such as energy efficiency and reduced environmental impact.
Many Ola Electric scooter users were unaware of or underutilising the various features and riding modes available to them. This lack of engagement with the scooter's full capabilities led to suboptimal user experiences and reduced the potential benefits of owning an electric scooter, such as energy efficiency and reduced environmental impact.
The Solution
The Solution
Analytics System
Gamification
Actionable Insights
Educate
Explore
Community Building
Analytics System
Analytics System
Gamification
Gamification
Actionable Insights
Actionable Insights
Educate
Educate
Explore
Explore
Community Building
Community Building
Our approach was to create a comprehensive, user-centric analytics system that transforms raw ride data into meaningful, actionable insights. By leveraging gamification principles, data visualization, and social sharing features, we developed a solution that not only educates users about their riding habits but also motivates them to explore the full potential of their Ola Electric scooters. The system is designed to cater to both data enthusiasts and casual riders, providing depth of information without sacrificing ease of use.
Our approach was to create a comprehensive, user-centric analytics system that transforms raw ride data into meaningful, actionable insights. By leveraging gamification principles, data visualization, and social sharing features, we developed a solution that not only educates users about their riding habits but also motivates them to explore the full potential of their Ola Electric scooters. The system is designed to cater to both data enthusiasts and casual riders, providing depth of information without sacrificing ease of use.
Our approach was to create a comprehensive, user-centric analytics system that transforms raw ride data into meaningful, actionable insights. By leveraging gamification principles, data visualization, and social sharing features, we developed a solution that not only educates users about their riding habits but also motivates them to explore the full potential of their Ola Electric scooters. The system is designed to cater to both data enthusiasts and casual riders, providing depth of information without sacrificing ease of use.
We developed an in-depth ride analytics system that gamifies the process of feature discovery and usage while providing valuable insights to users. The solution included :
We developed an in-depth ride analytics system that gamifies the process of feature discovery and usage while providing valuable insights to users. The solution included :
We developed an in-depth ride analytics system that gamifies the process of feature discovery and usage while providing valuable insights to users. The solution included :
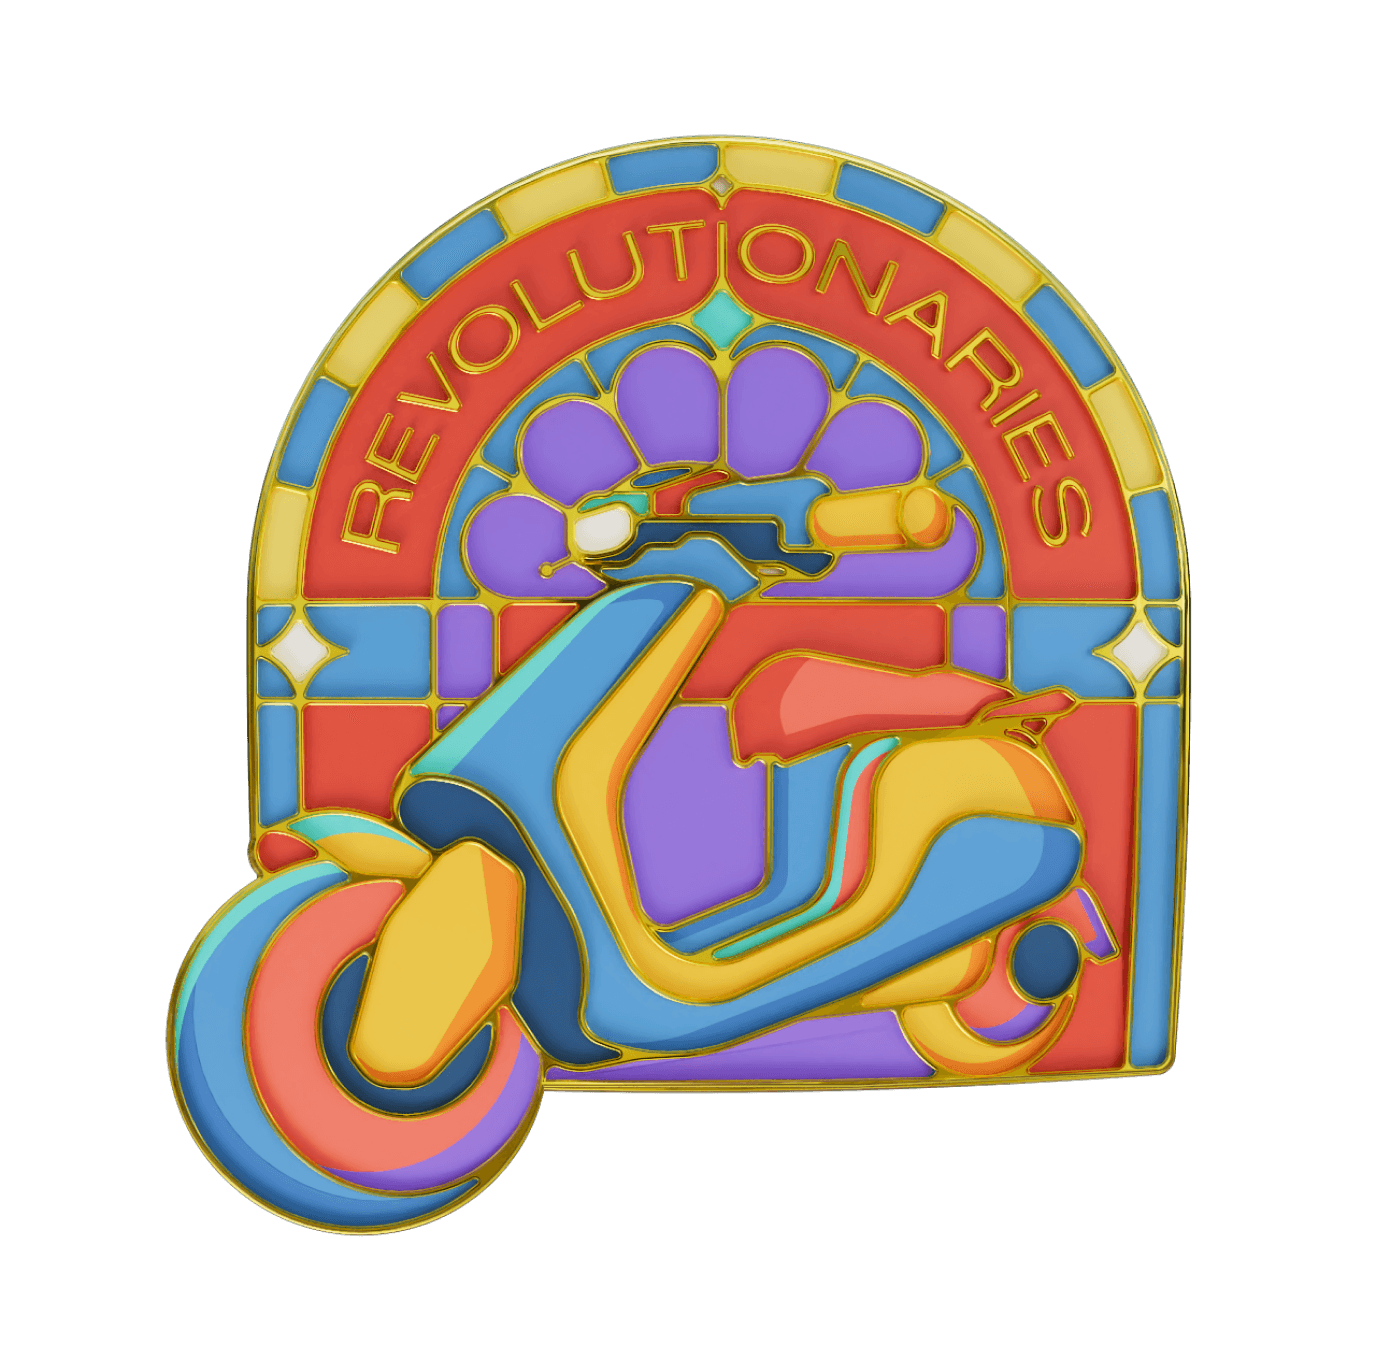
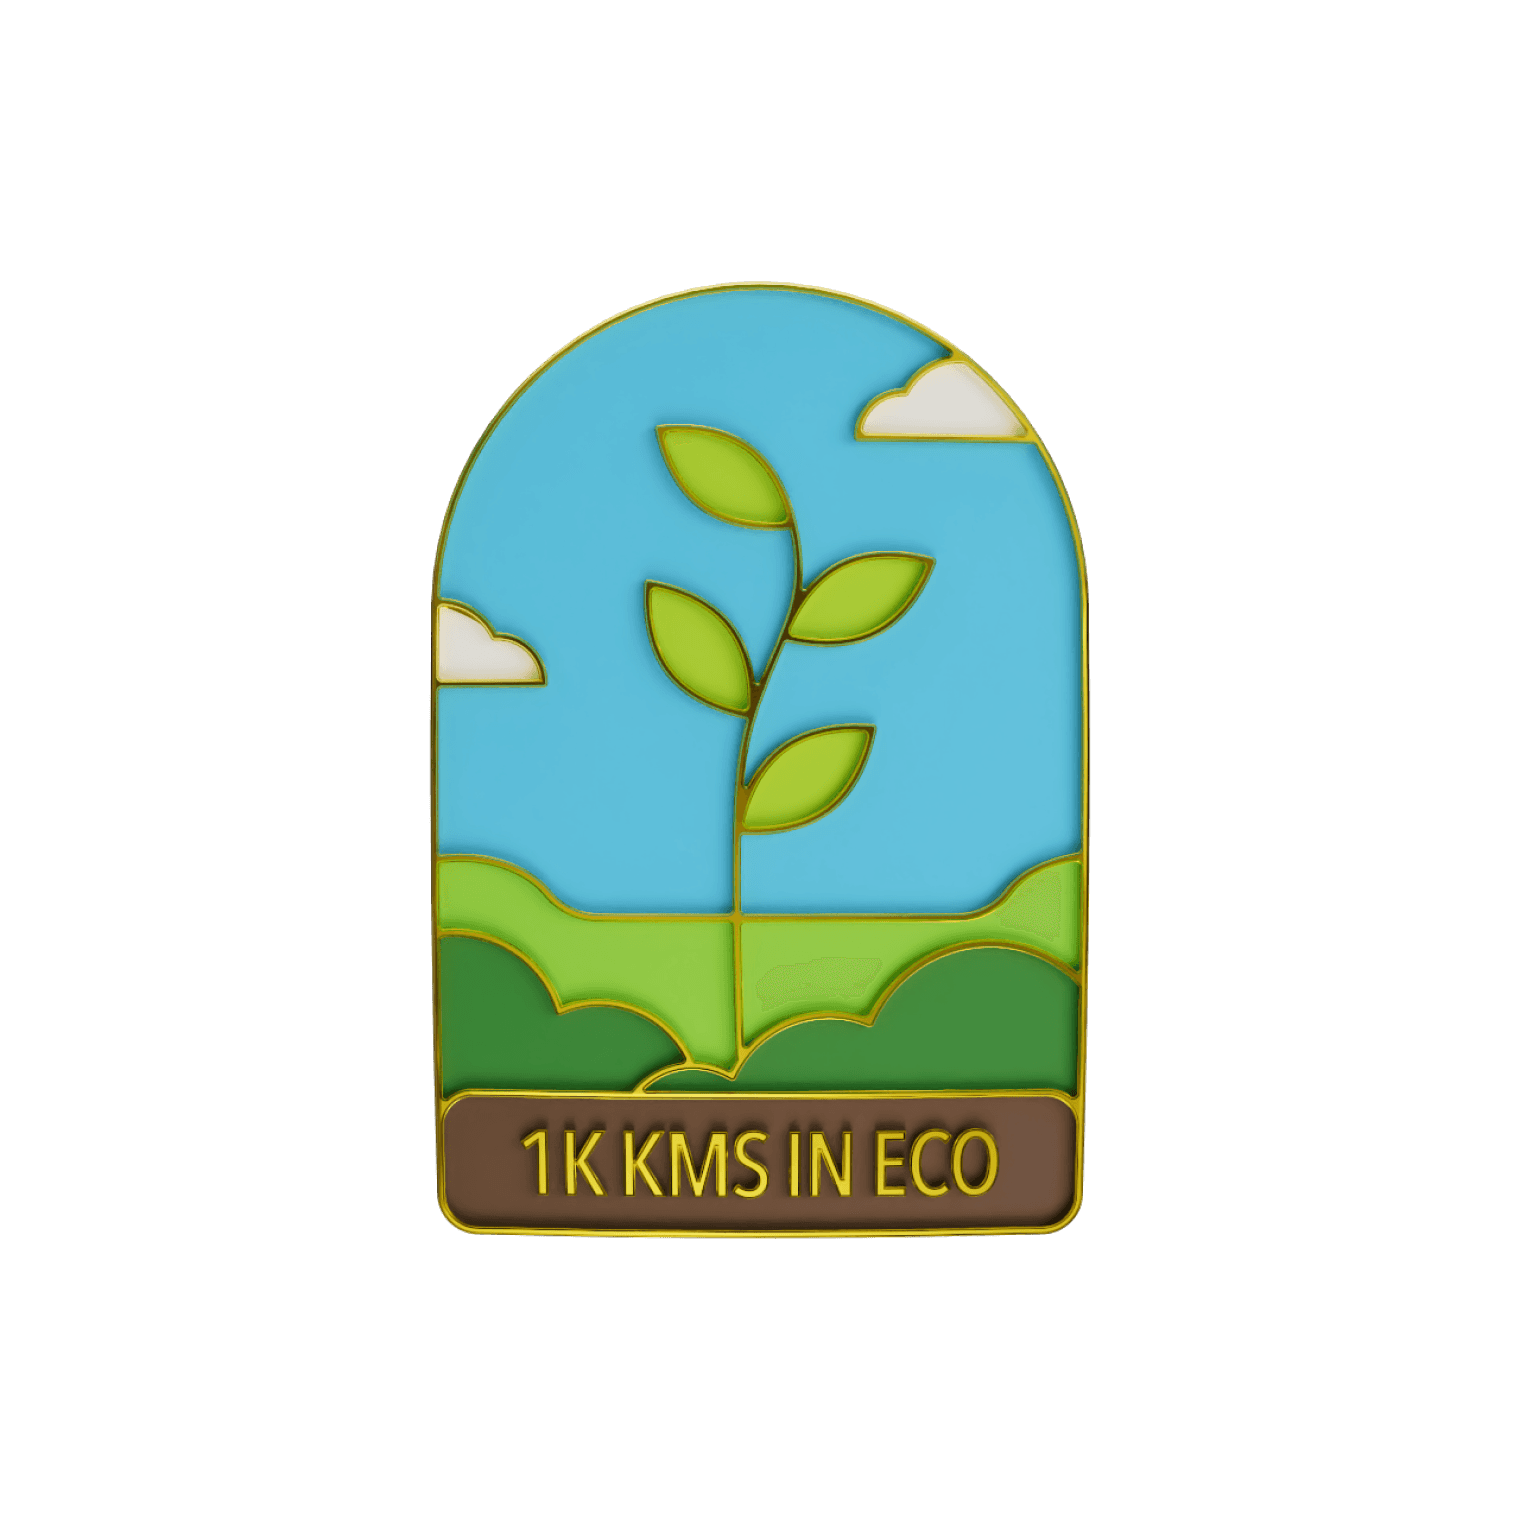
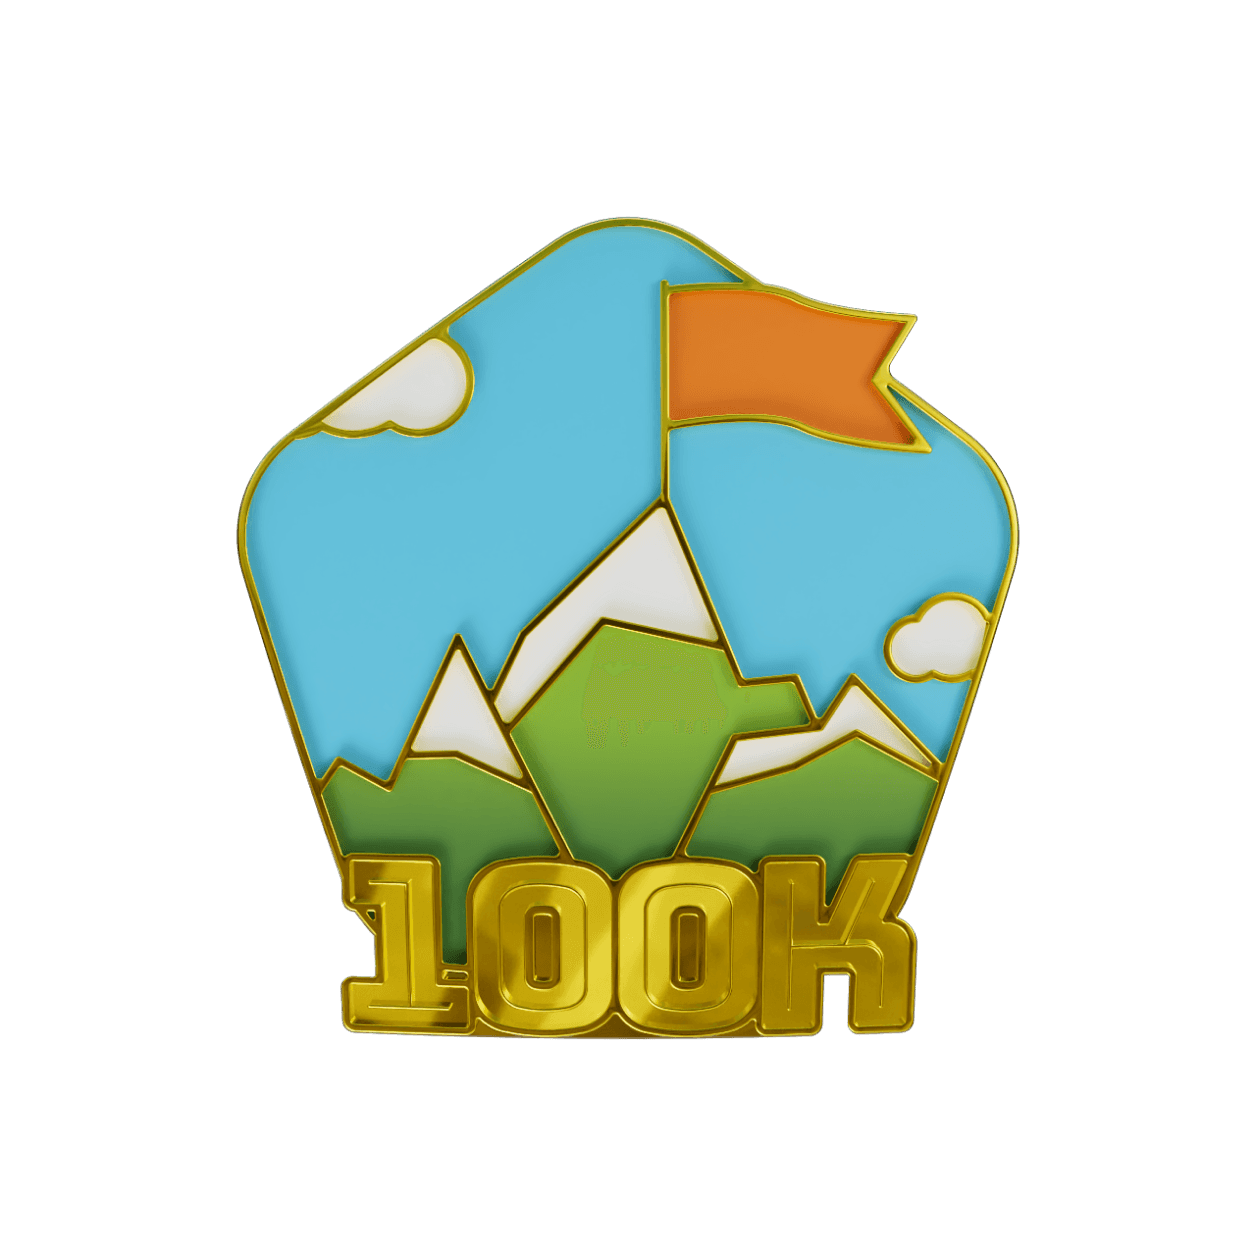
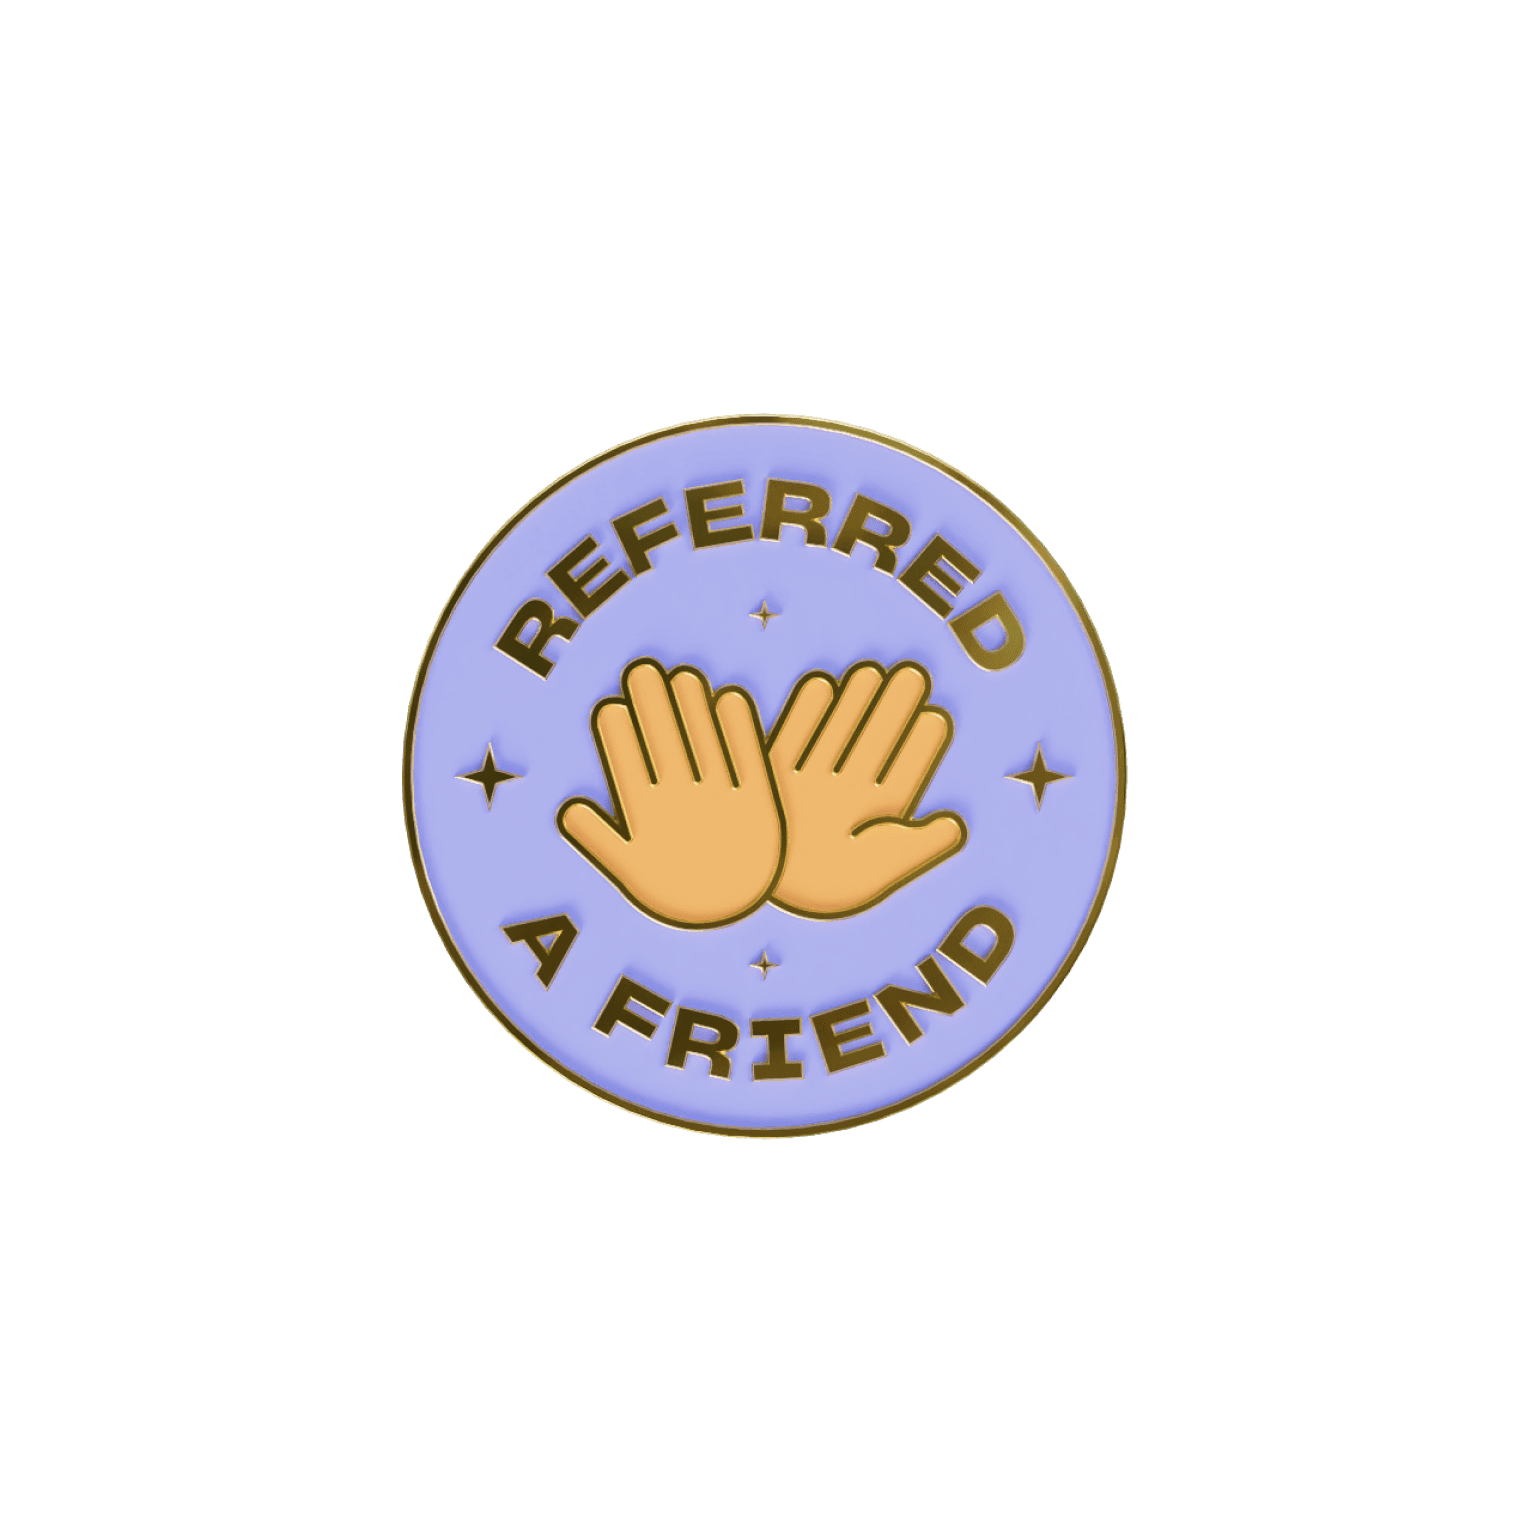
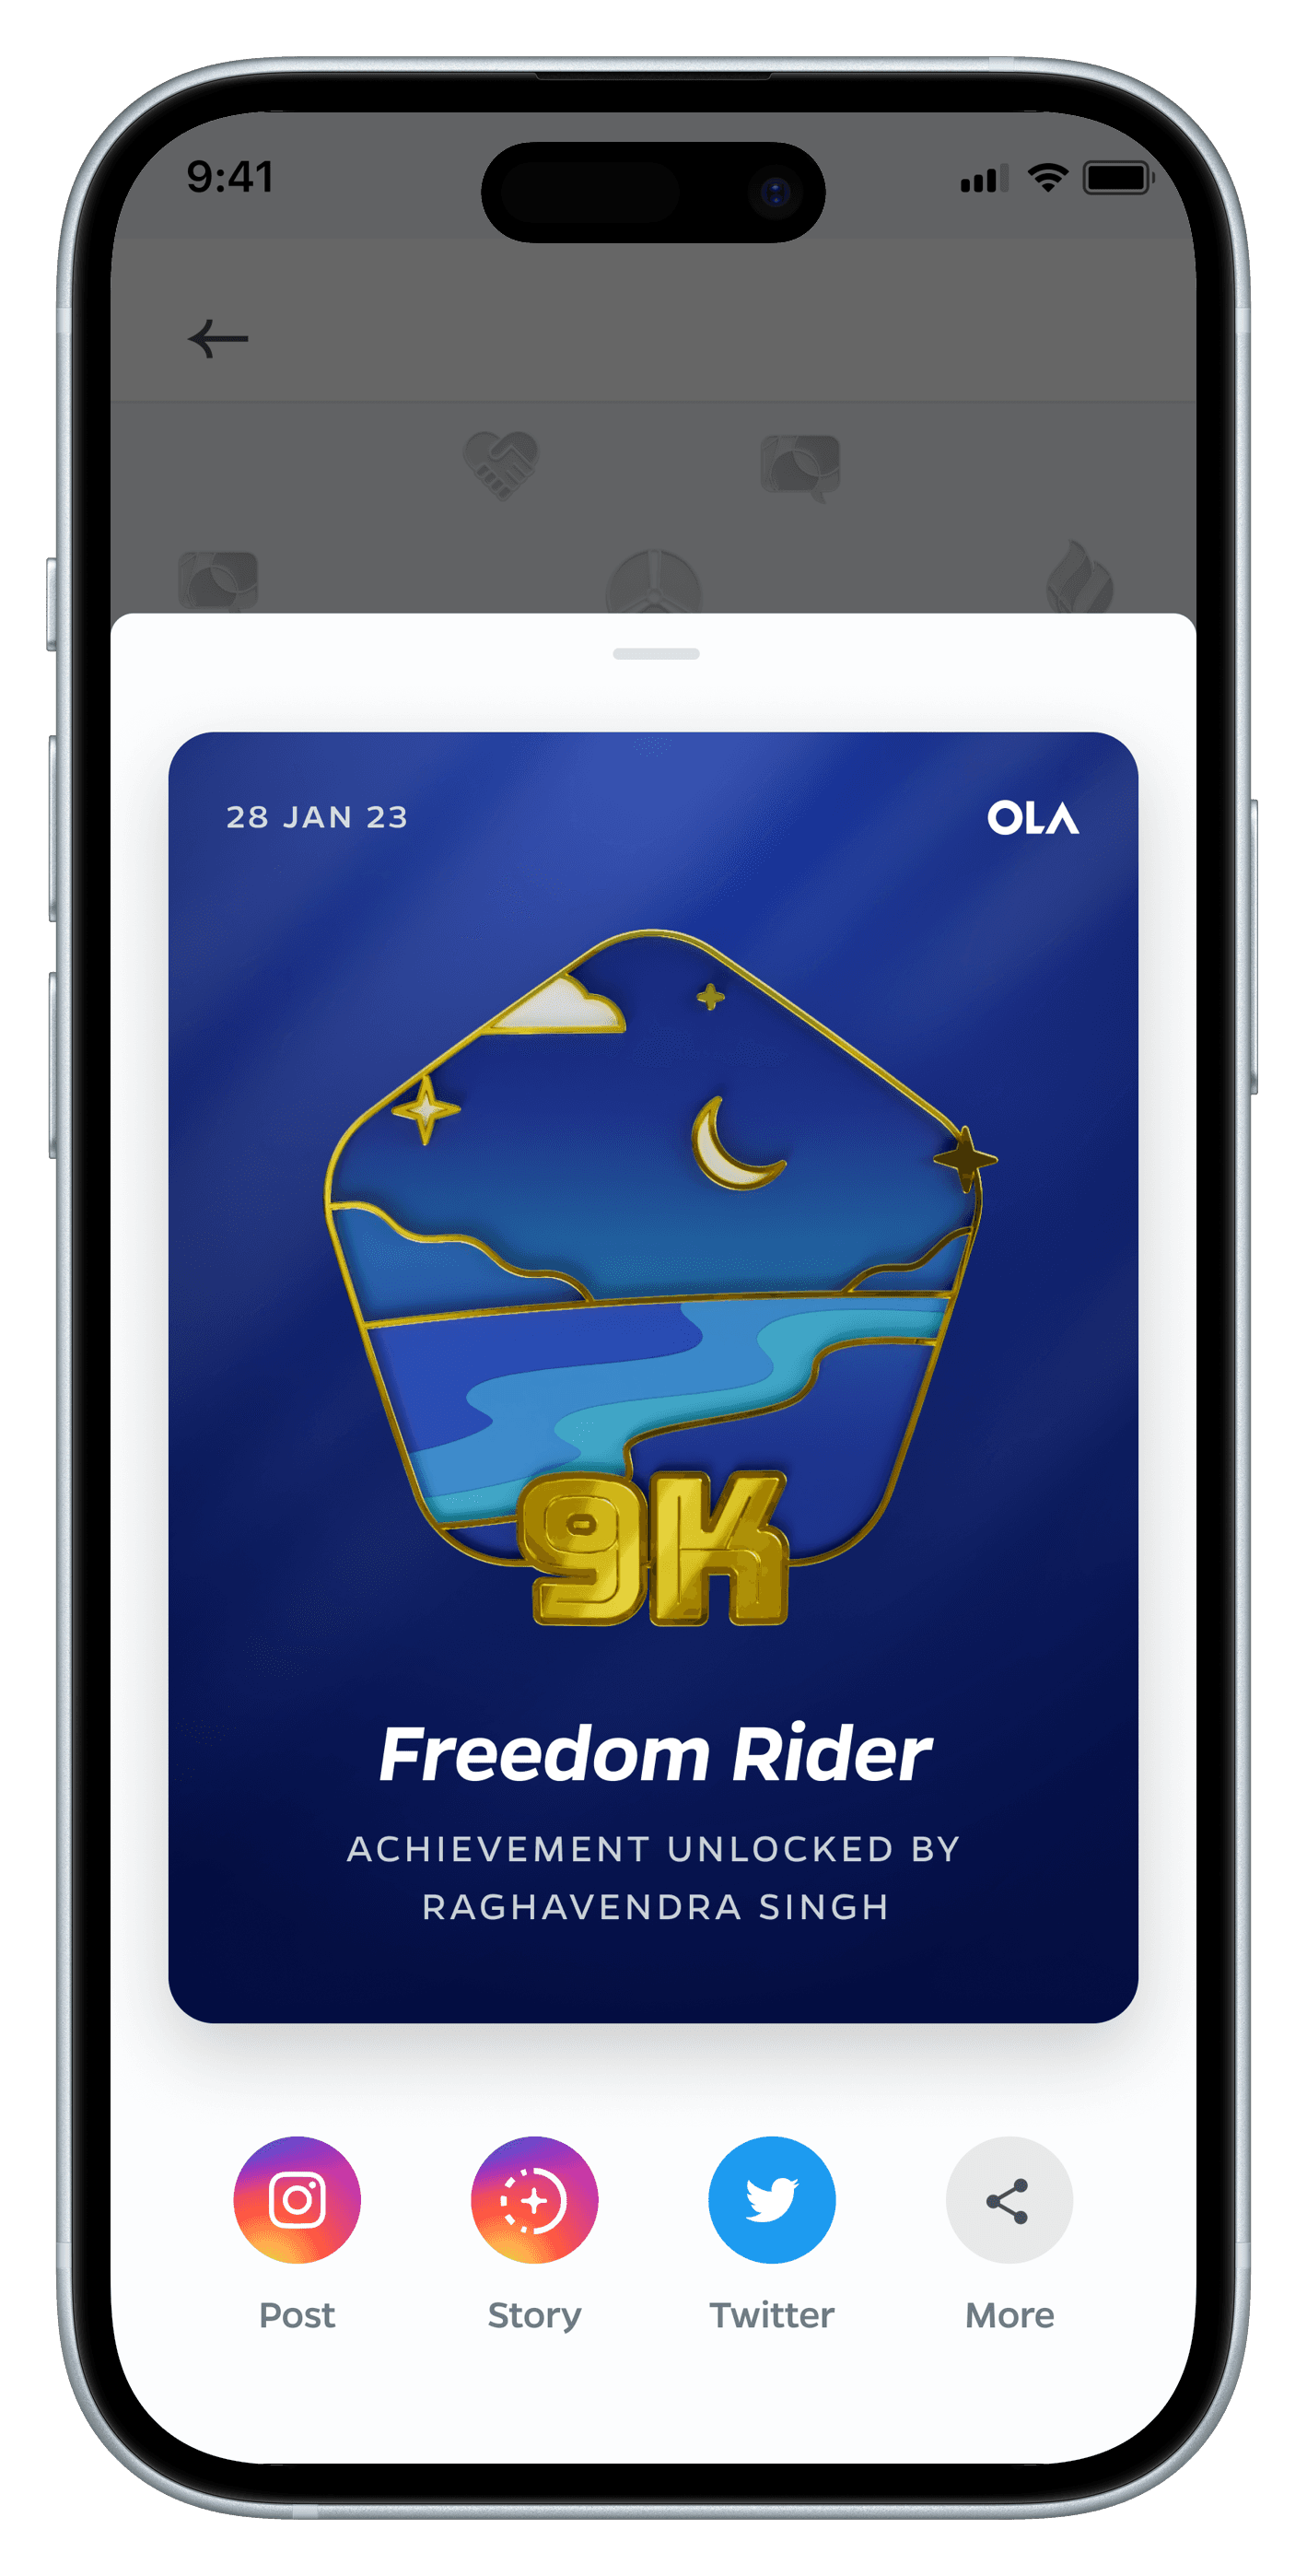
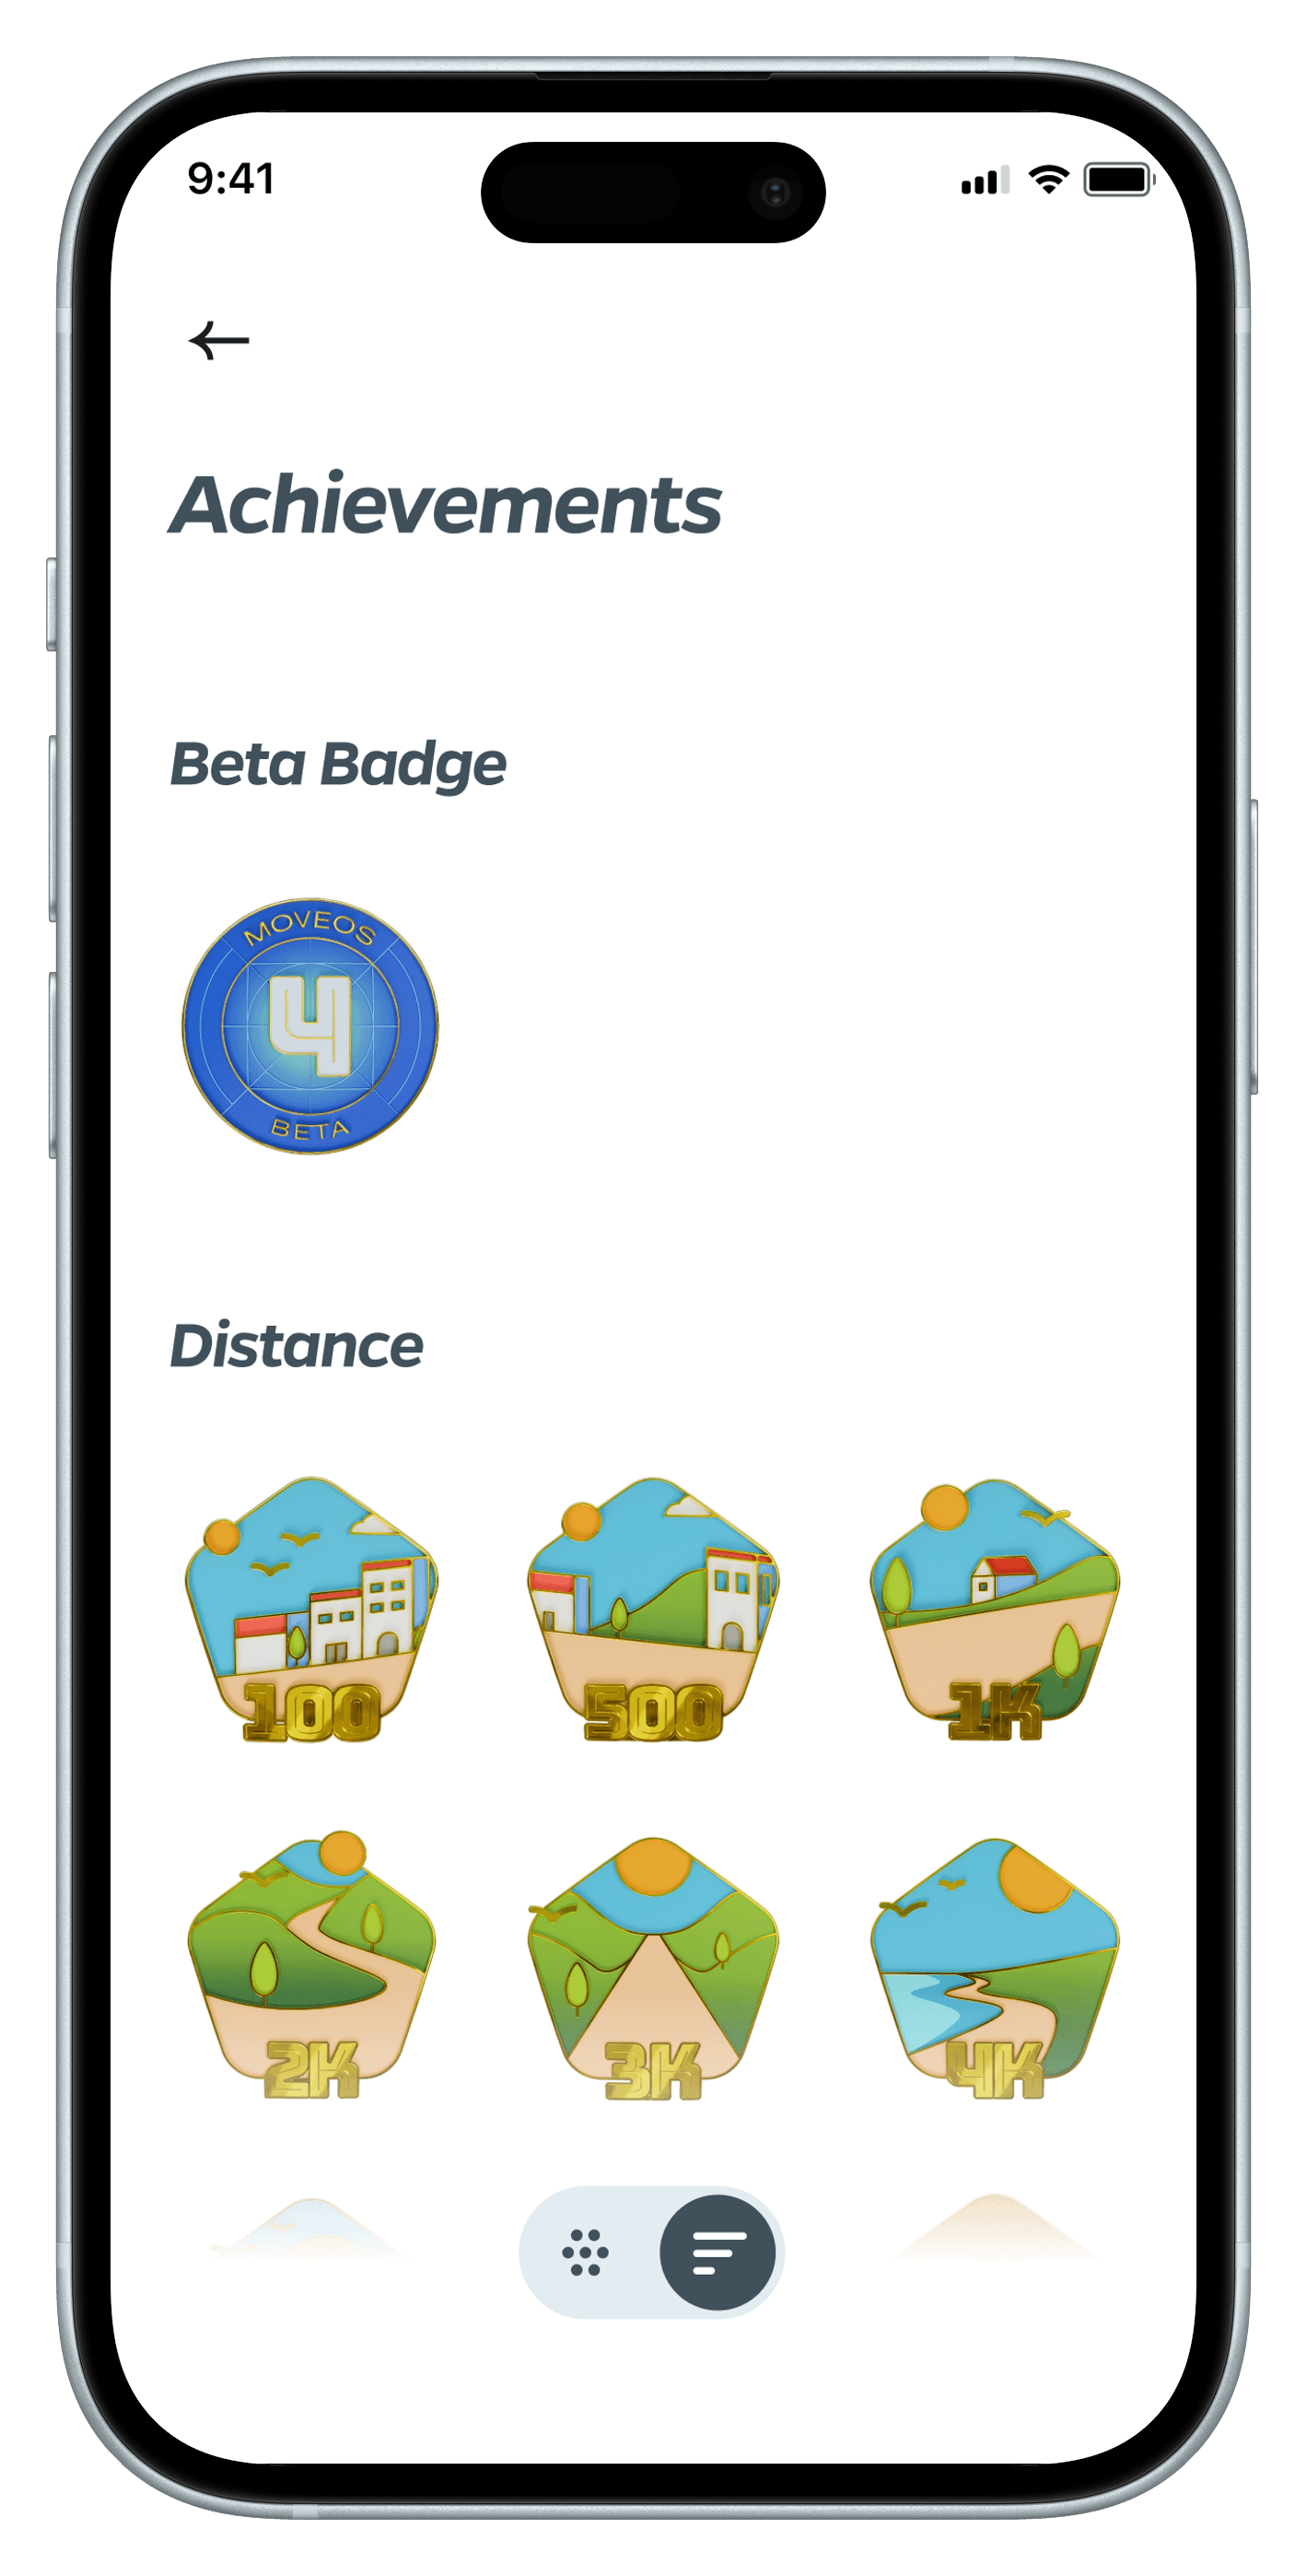
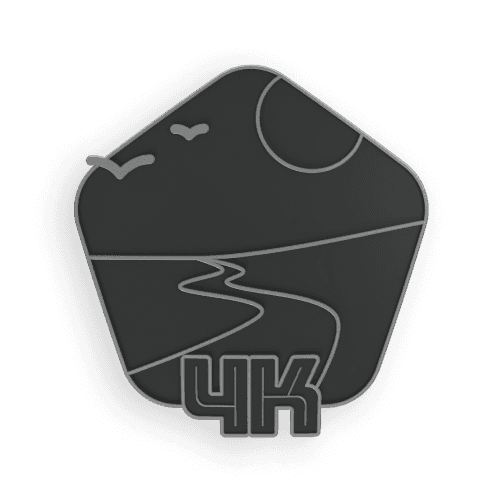
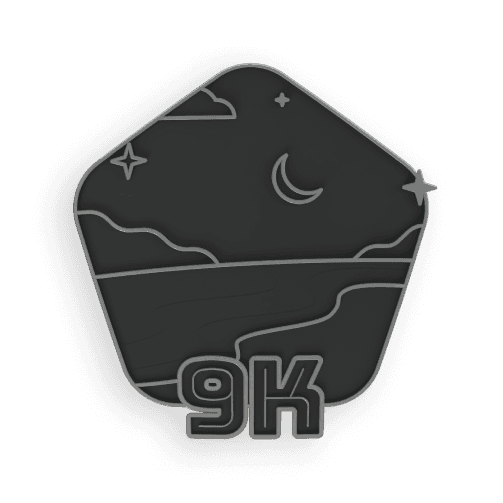
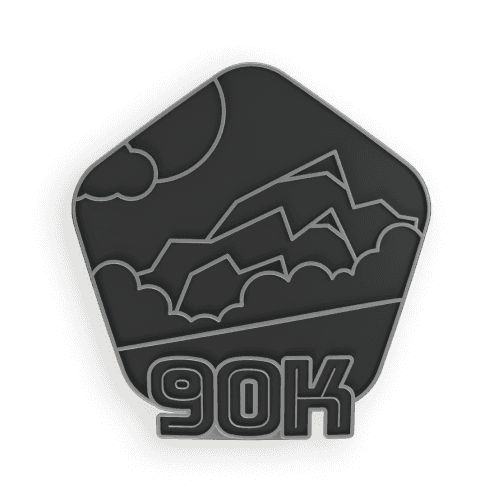
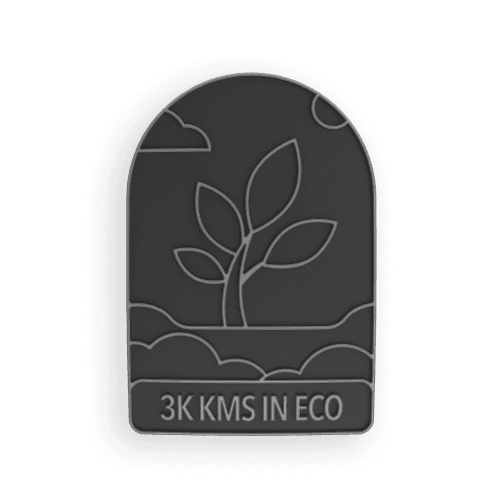
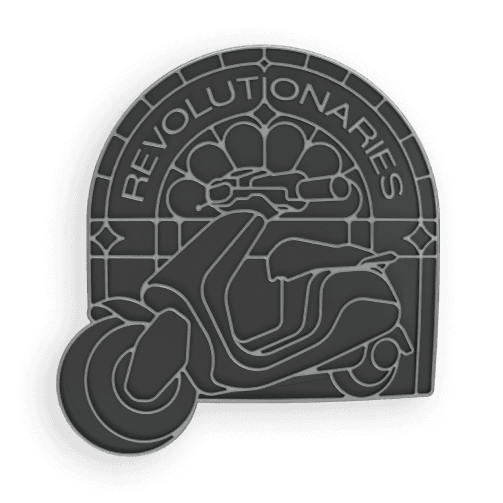
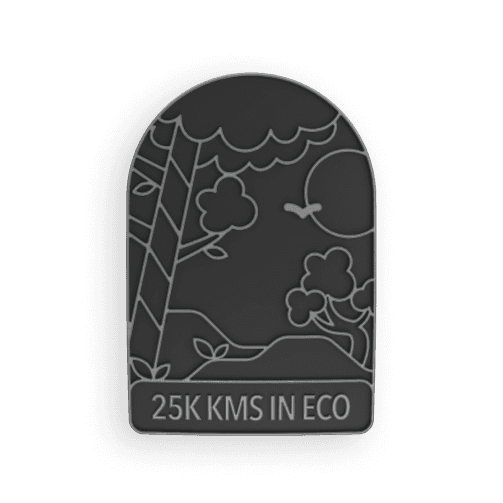
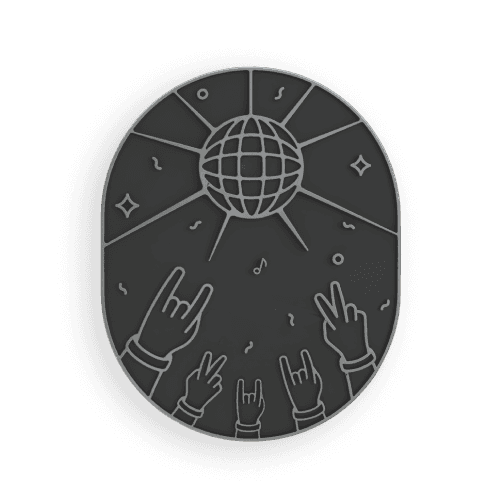
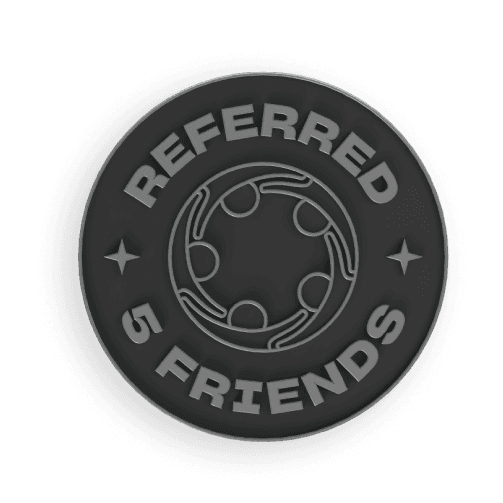
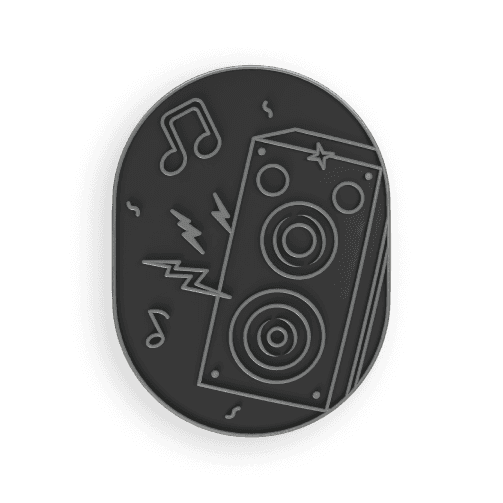
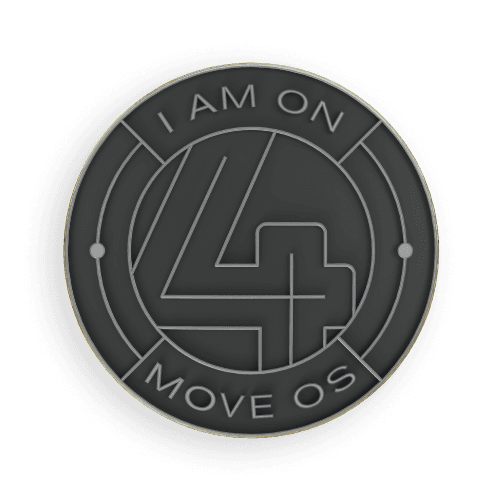
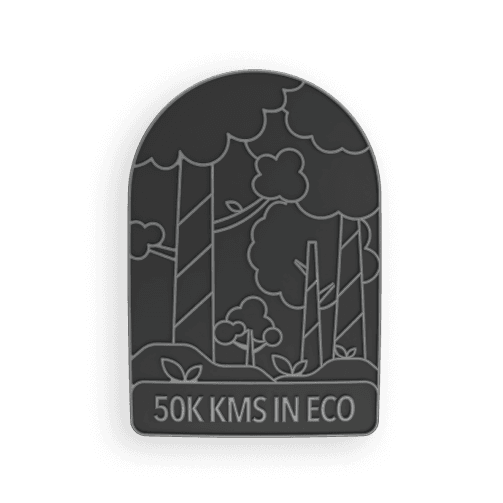
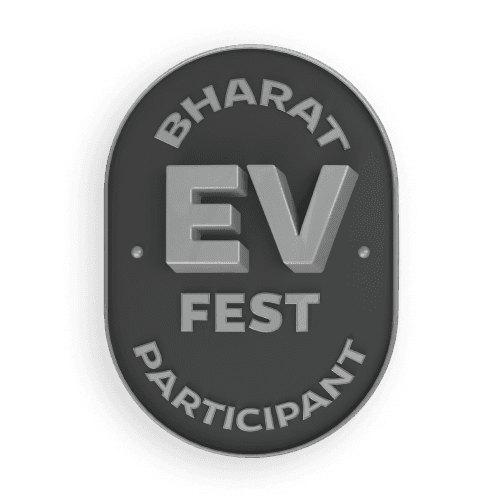
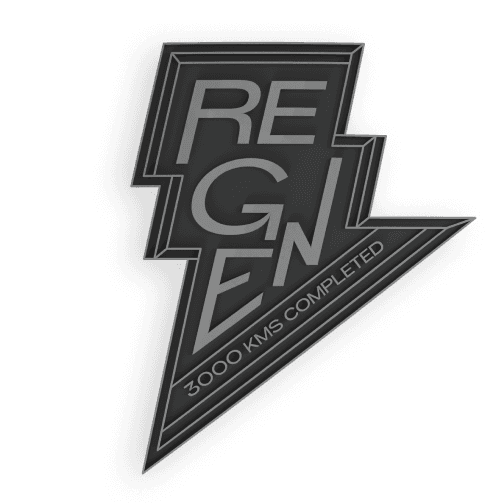
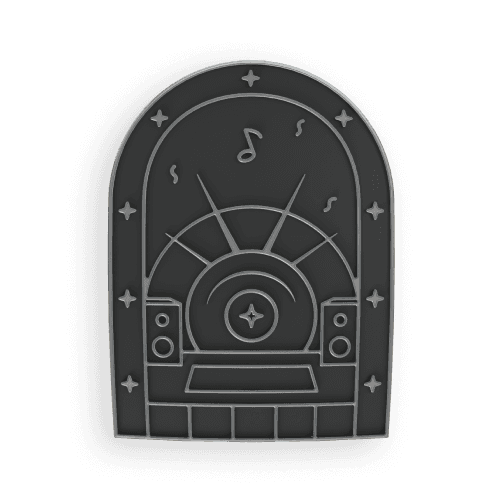
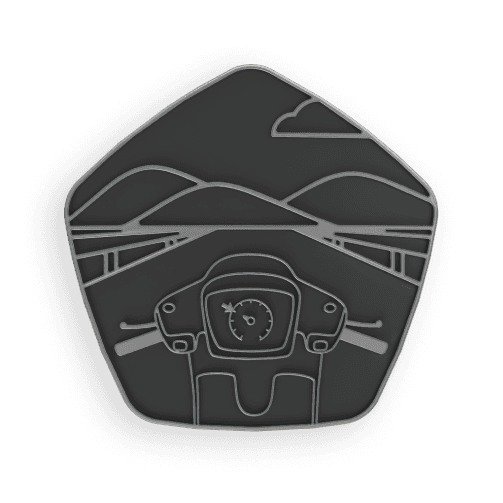
Achievement System and Badges
Achievement System and Badges
Visually appealing badges designed with vibrant colours and iconic imagery
Categories include distance , eco-friendly riding, music , special occasions and more
Clear progression system visible in badge designs, encouraging users to "level up"
Seamless integration into the main app interface with delightful animations upon earning
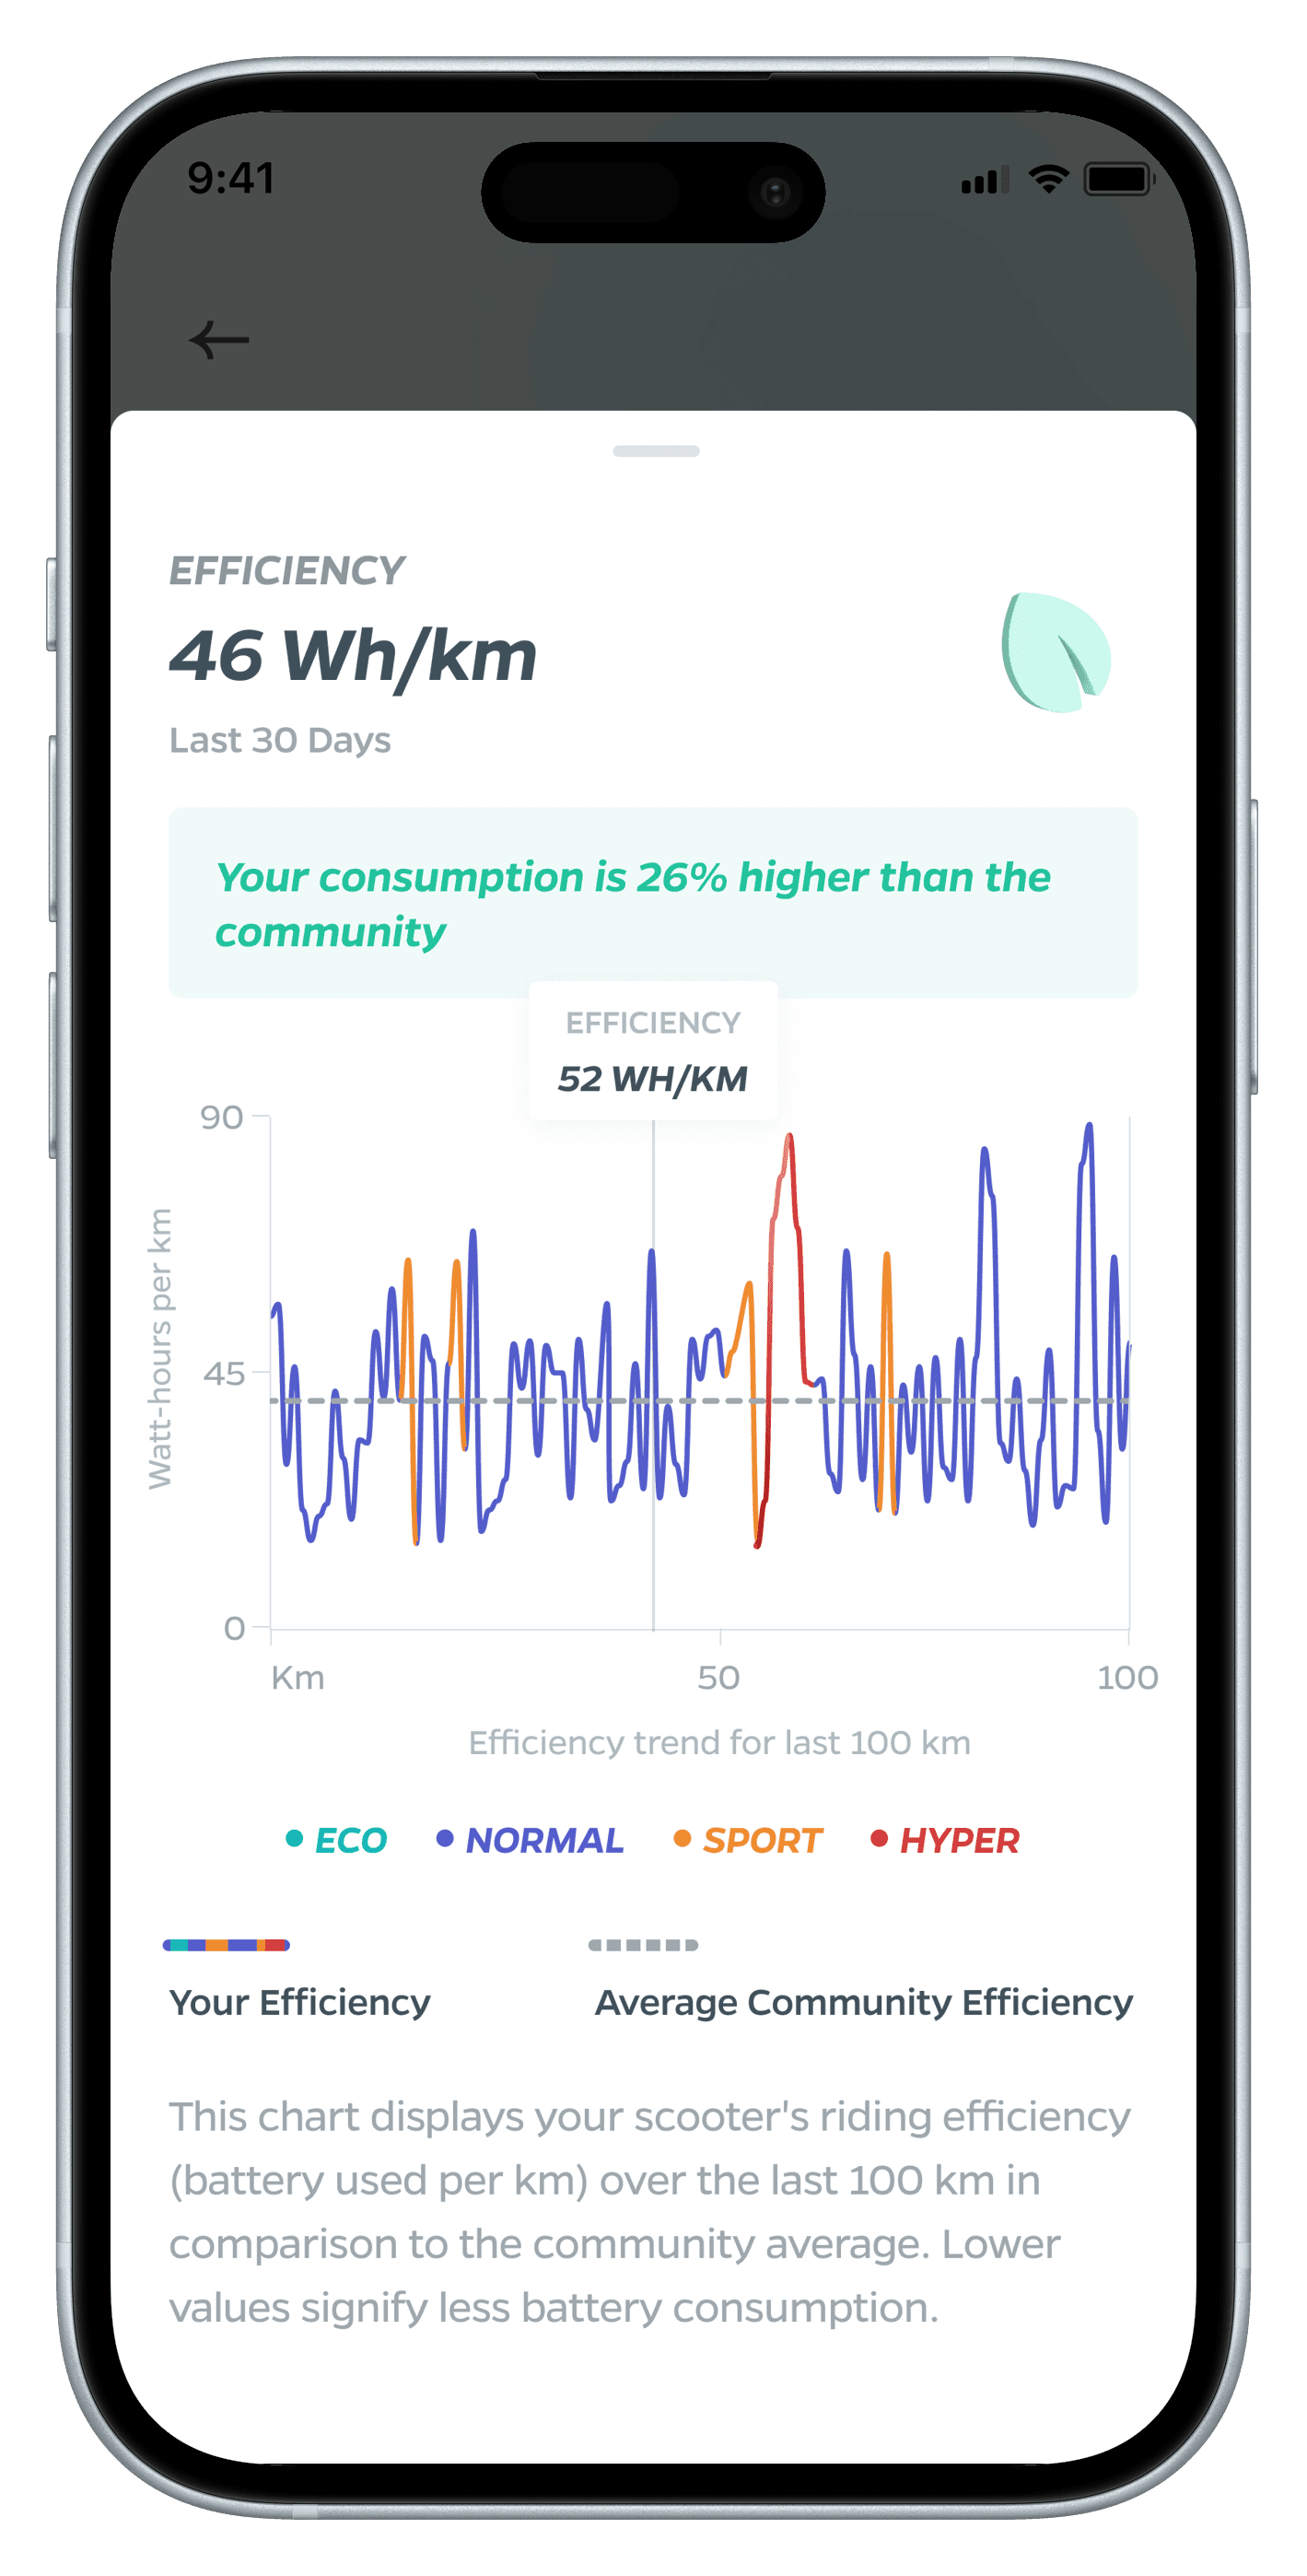
Energy Insights
Energy Insights
Dynamic efficiency graph showing Wh/km over the last 100 km
Real-time comparison to community average efficiency
Breakdown of efficiency by riding mode with color-coded visualization
Projections of potential range improvements based on mode adjustments
Tips for optimal mode selection based on route type and distance
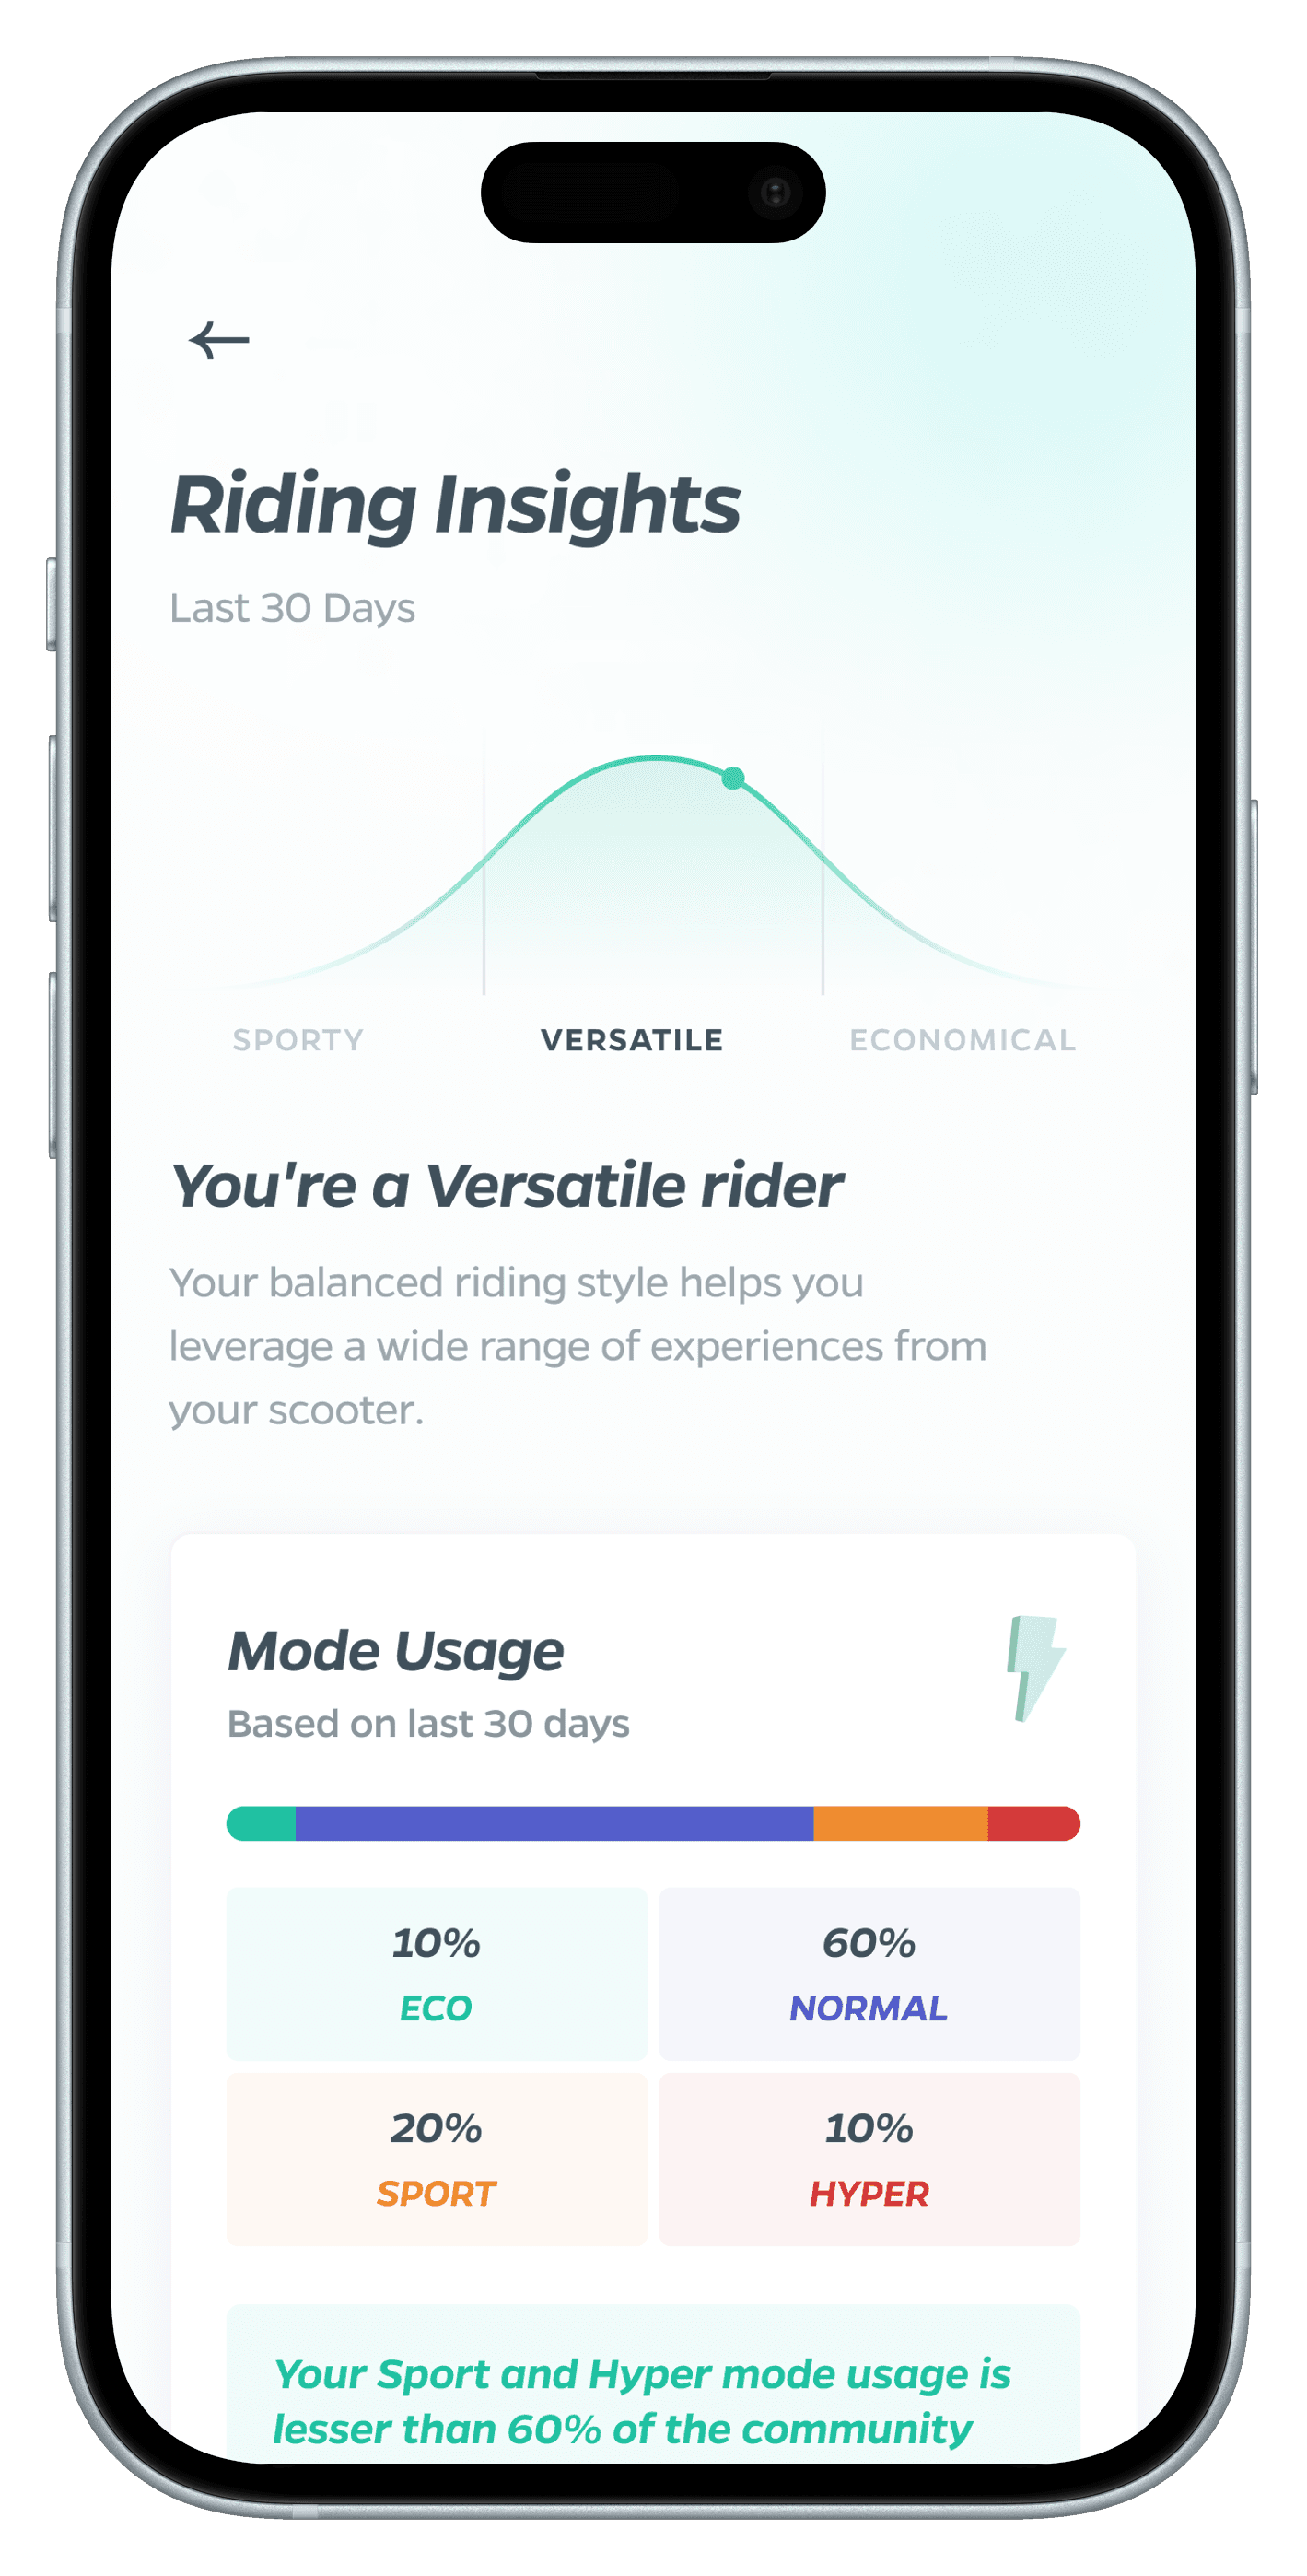
Riding Insights
Riding Insights
Personalized riding style feedback (e.g., "Versatile rider", "Eco-warrior")
Detailed breakdown of energy mode usage (Eco, Normal, Sport, Hyper) with community comparisons
Analysis of riding patterns: late-night riding, uphill riding, and regenerative braking usage
Custom tips for improving range and efficiency based on individual riding habits
Insights on how different modes affect battery consumption and range

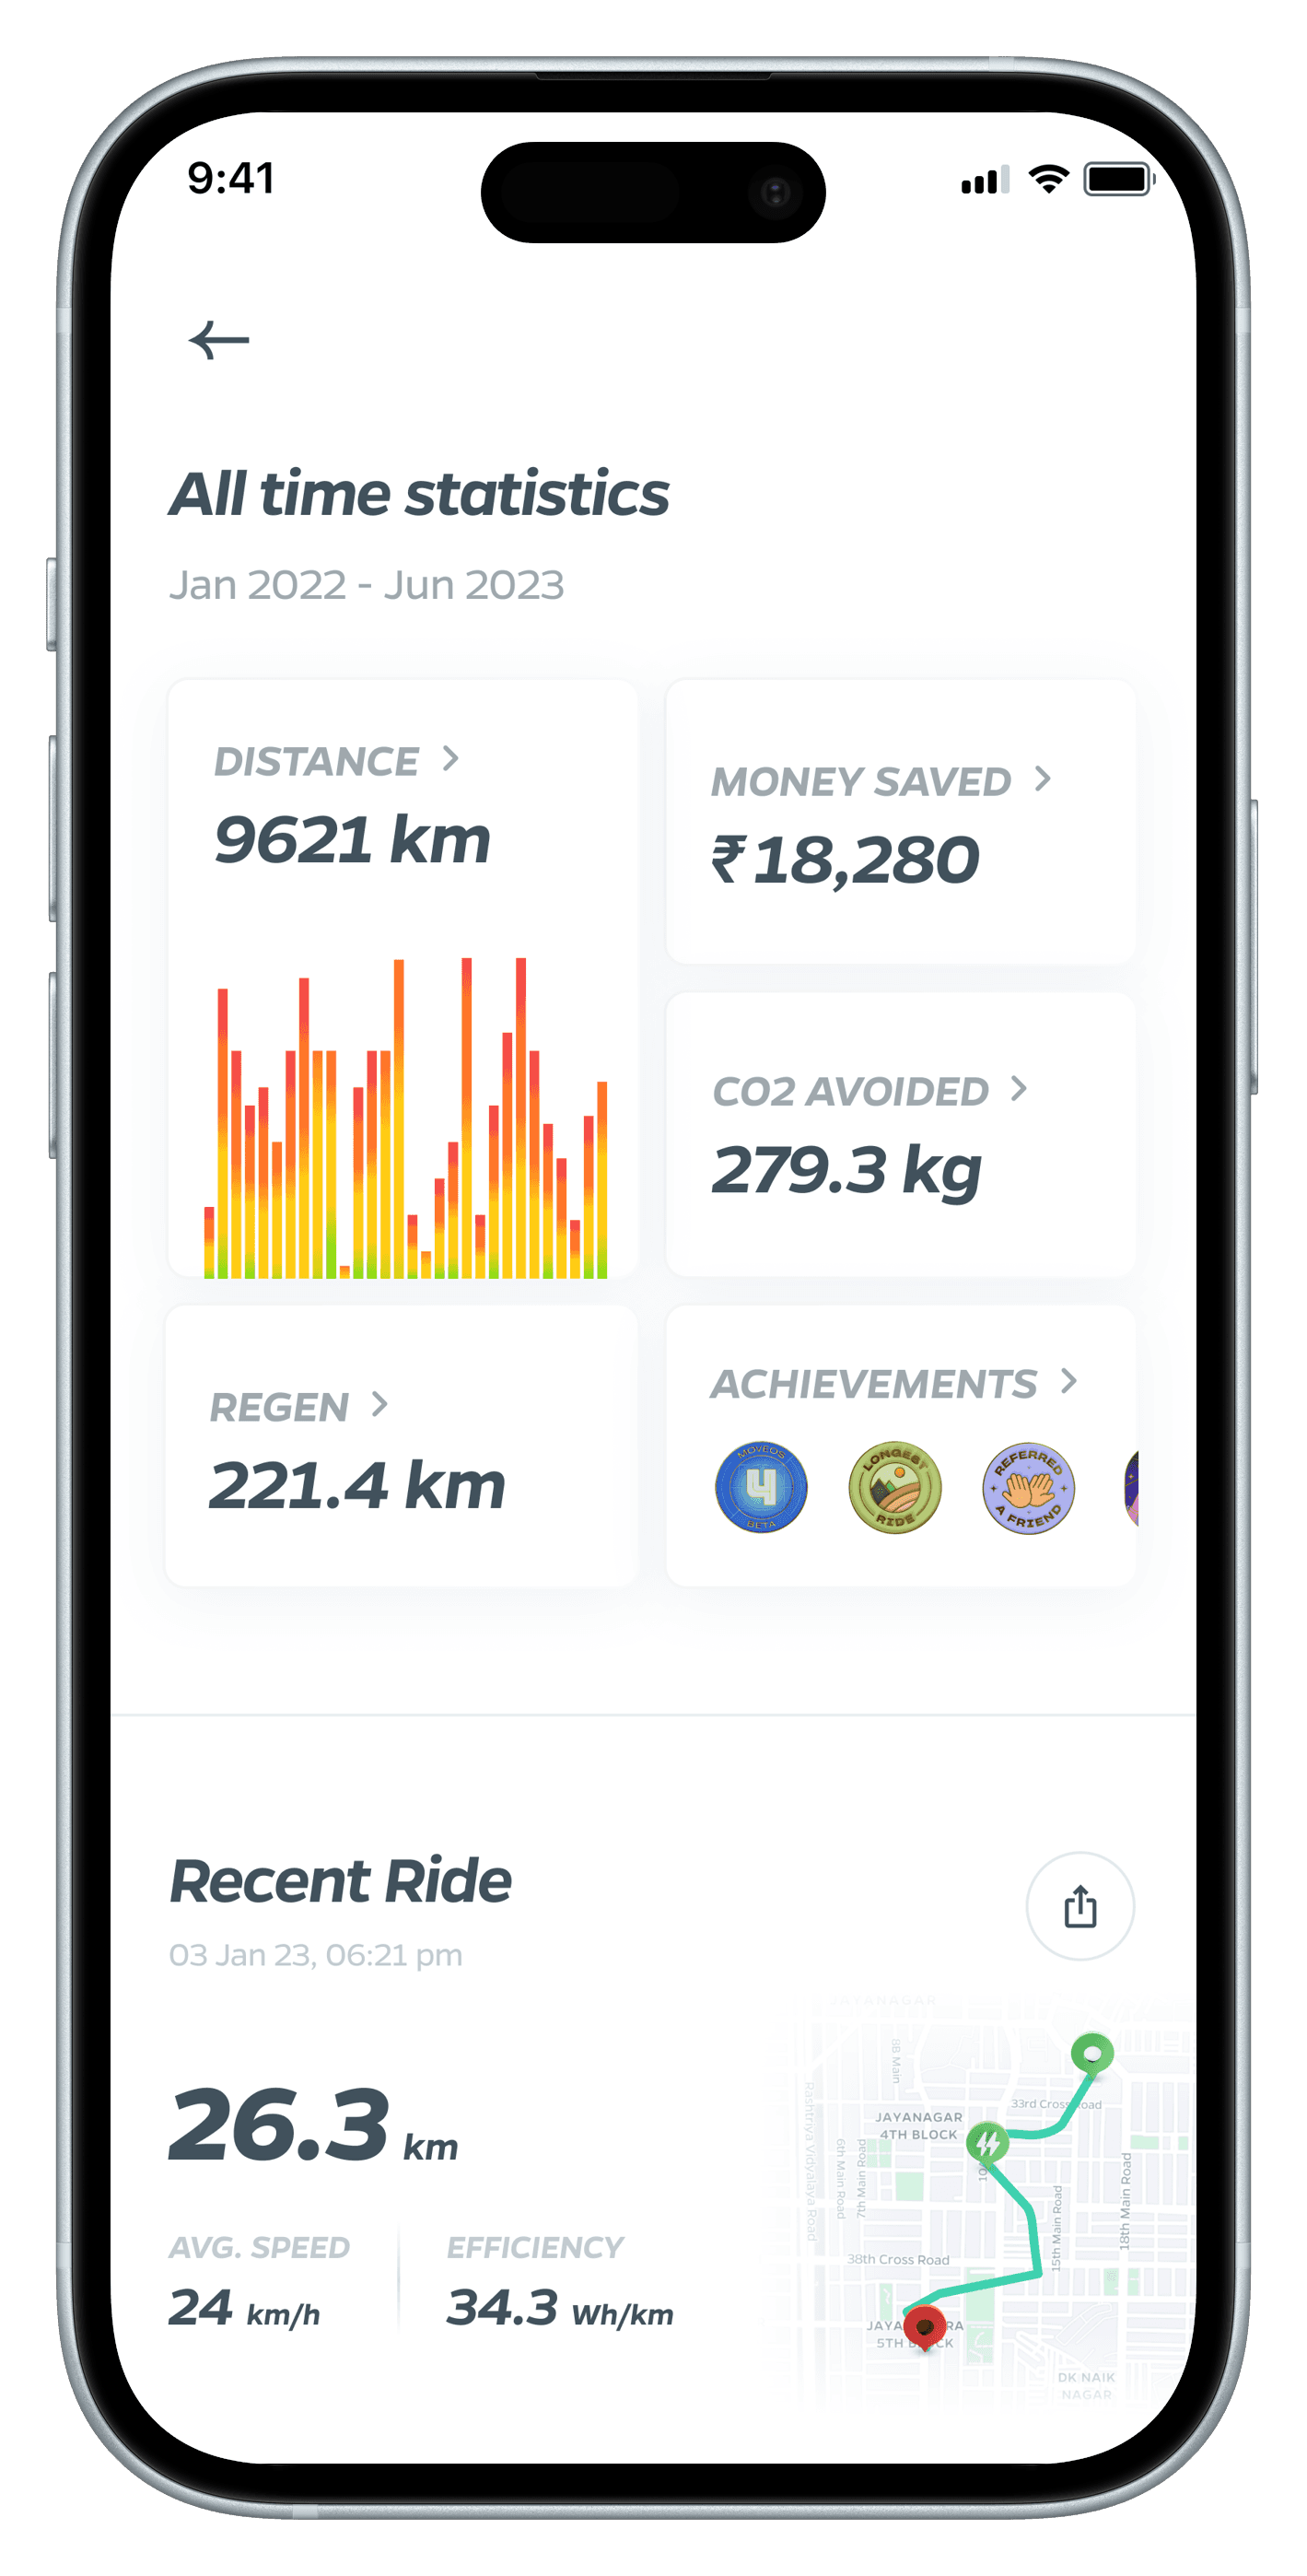
Detailed Ride Summaries
Detailed Ride Summaries
Interactive route map with start, end locations, and points of interest
Comprehensive metrics: distance, duration, average/top speeds
Granular riding mode usage breakdown with time spent in each mode
Ride efficiency (Wh/km) with historical comparison
Range regenerated through braking with tips for improvement
All-Time Statistics Dashboard
All-Time Statistics Dashboard
Visually engaging graphs for total distance traveled, money saved, and CO2 emissions avoided
Cumulative regenerated range with equivalent environmental impact metrics
Leaderboards for eco-friendly riding within the user's city or region
Personalized milestones and goal-setting features
Visually engaging graphs for total distance traveled, money saved, and CO2 emissions avoided
Cumulative regenerated range with equivalent environmental impact metrics
Leaderboards for eco-friendly riding within the user's city or region
Personalized milestones and goal-setting features
Visually engaging graphs for total distance traveled, money saved, and CO2 emissions avoided
Cumulative regenerated range with equivalent environmental impact metrics
Leaderboards for eco-friendly riding within the user's city or region
Personalized milestones and goal-setting features
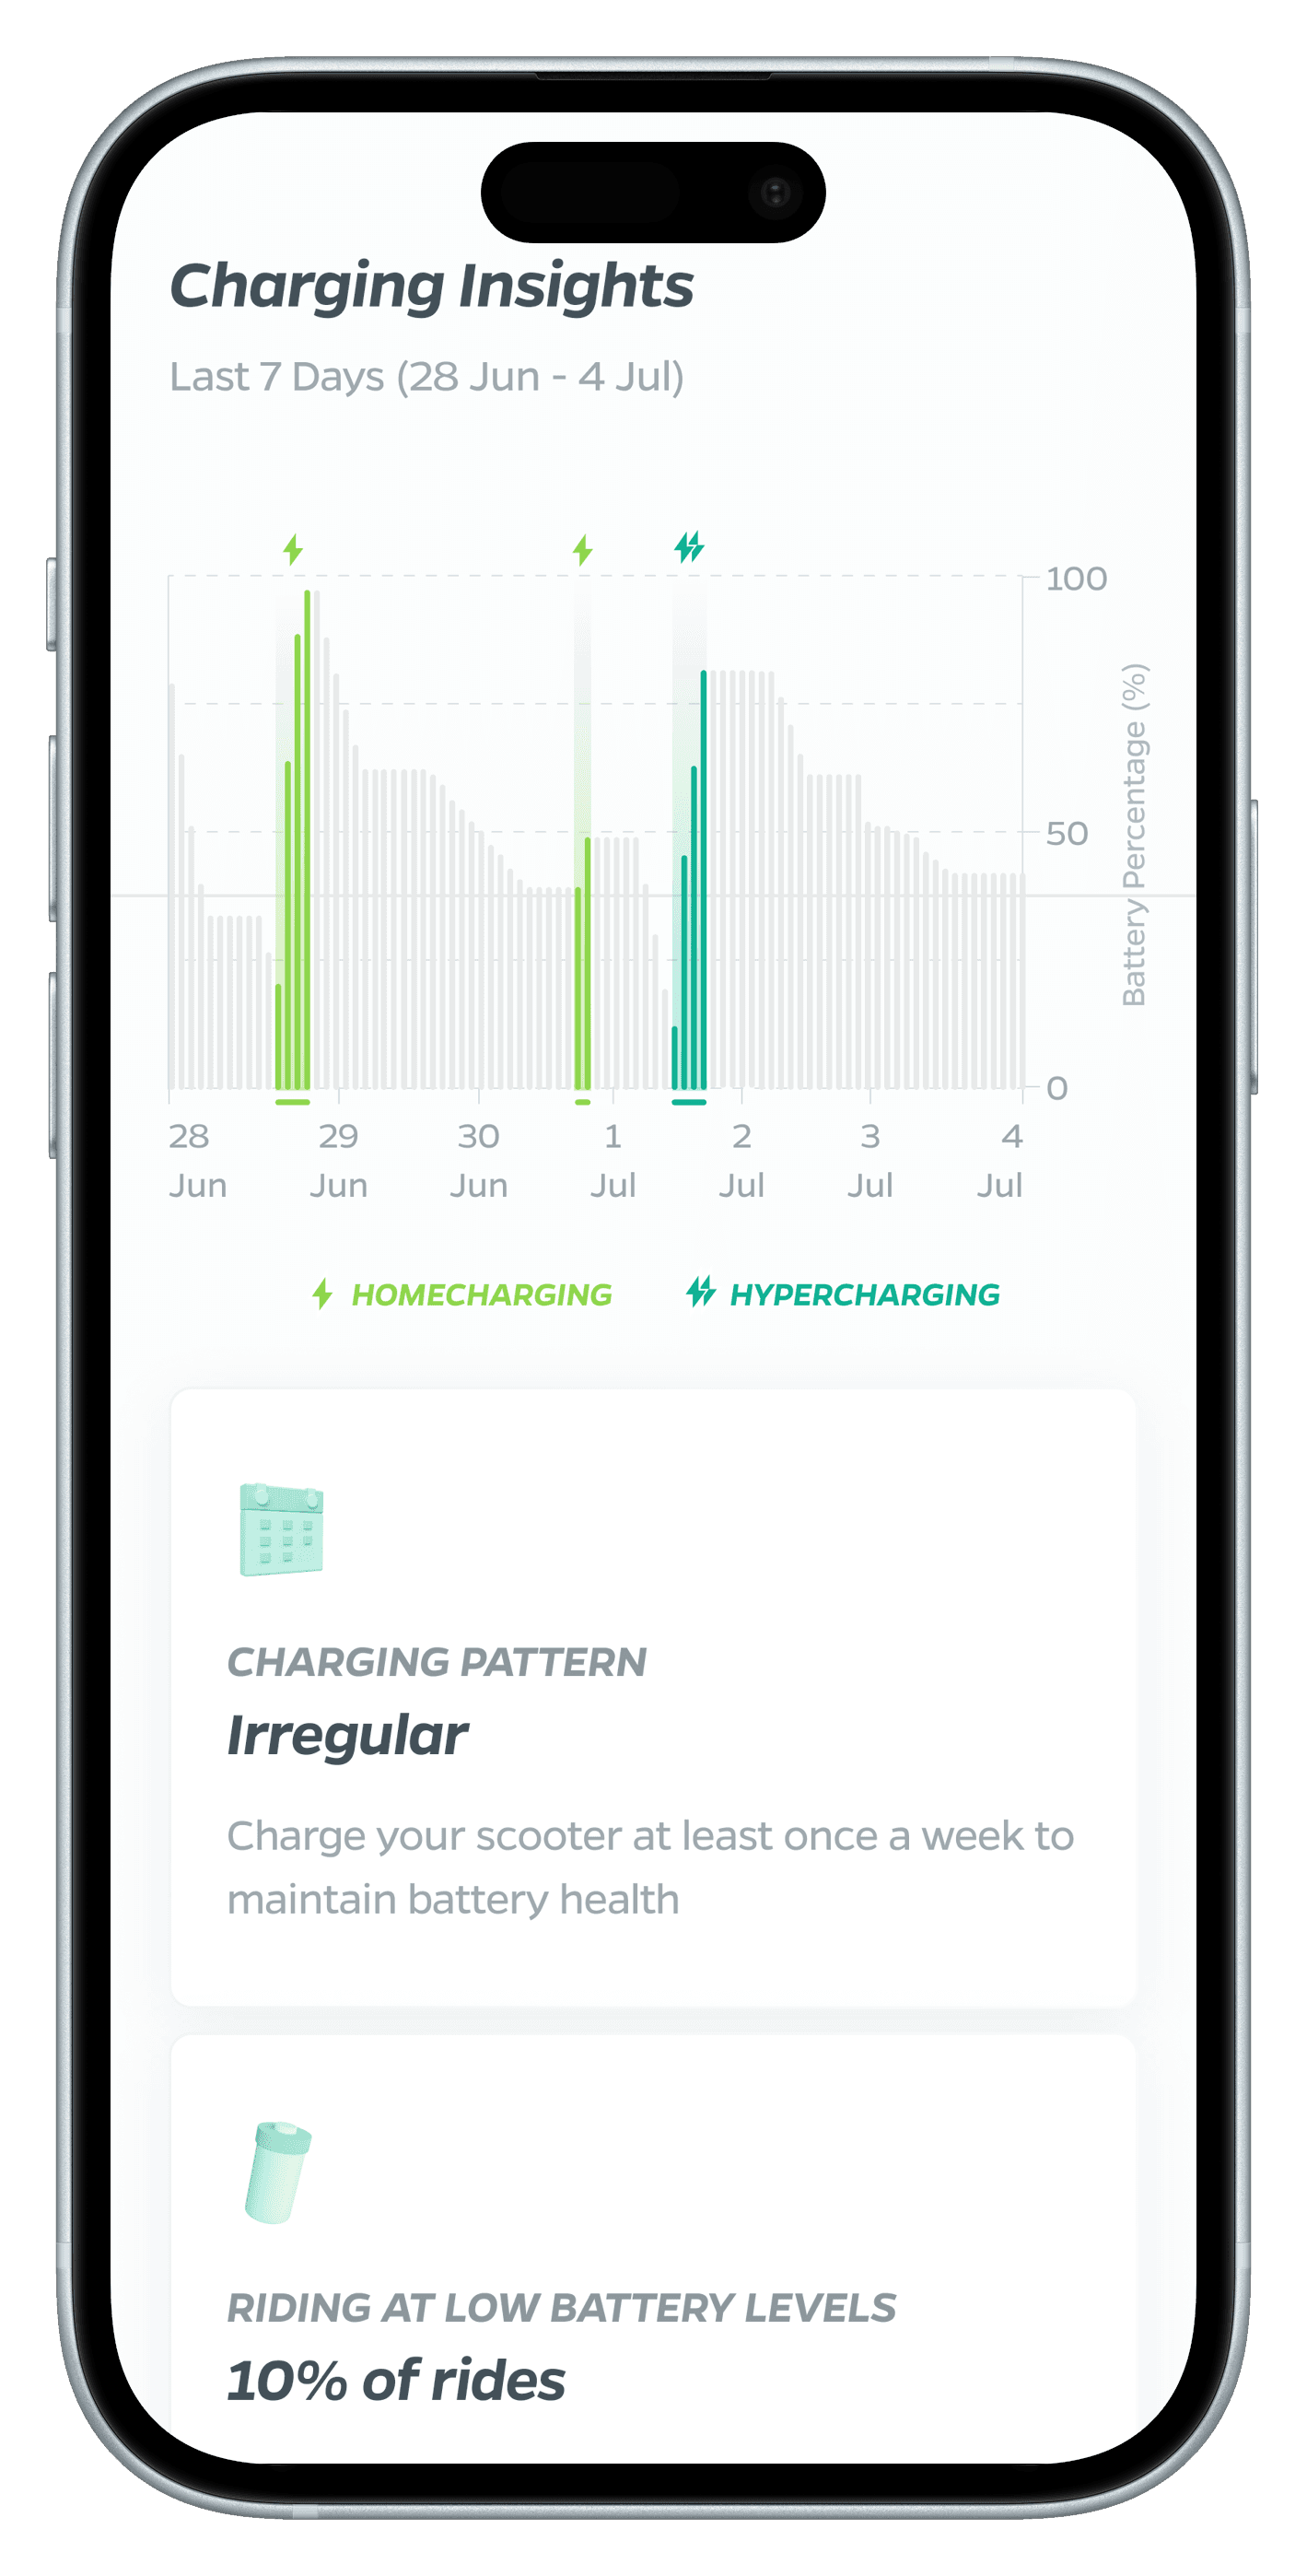
Charging Insights
Charging Insights
Visualization of charging patterns (home vs. public charging)
Personalized charging pattern analysis
Battery health tips and long-term battery life projections
Recommendations for optimal charging times based on electricity rates and usage patterns
Visualization of charging patterns (home vs. public charging)
Personalized charging pattern analysis
Battery health tips and long-term battery life projections
Recommendations for optimal charging times based on electricity rates and usage patterns
Visualization of charging patterns (home vs. public charging)
Personalized charging pattern analysis
Battery health tips and long-term battery life projections
Recommendations for optimal charging times based on electricity rates and usage patterns
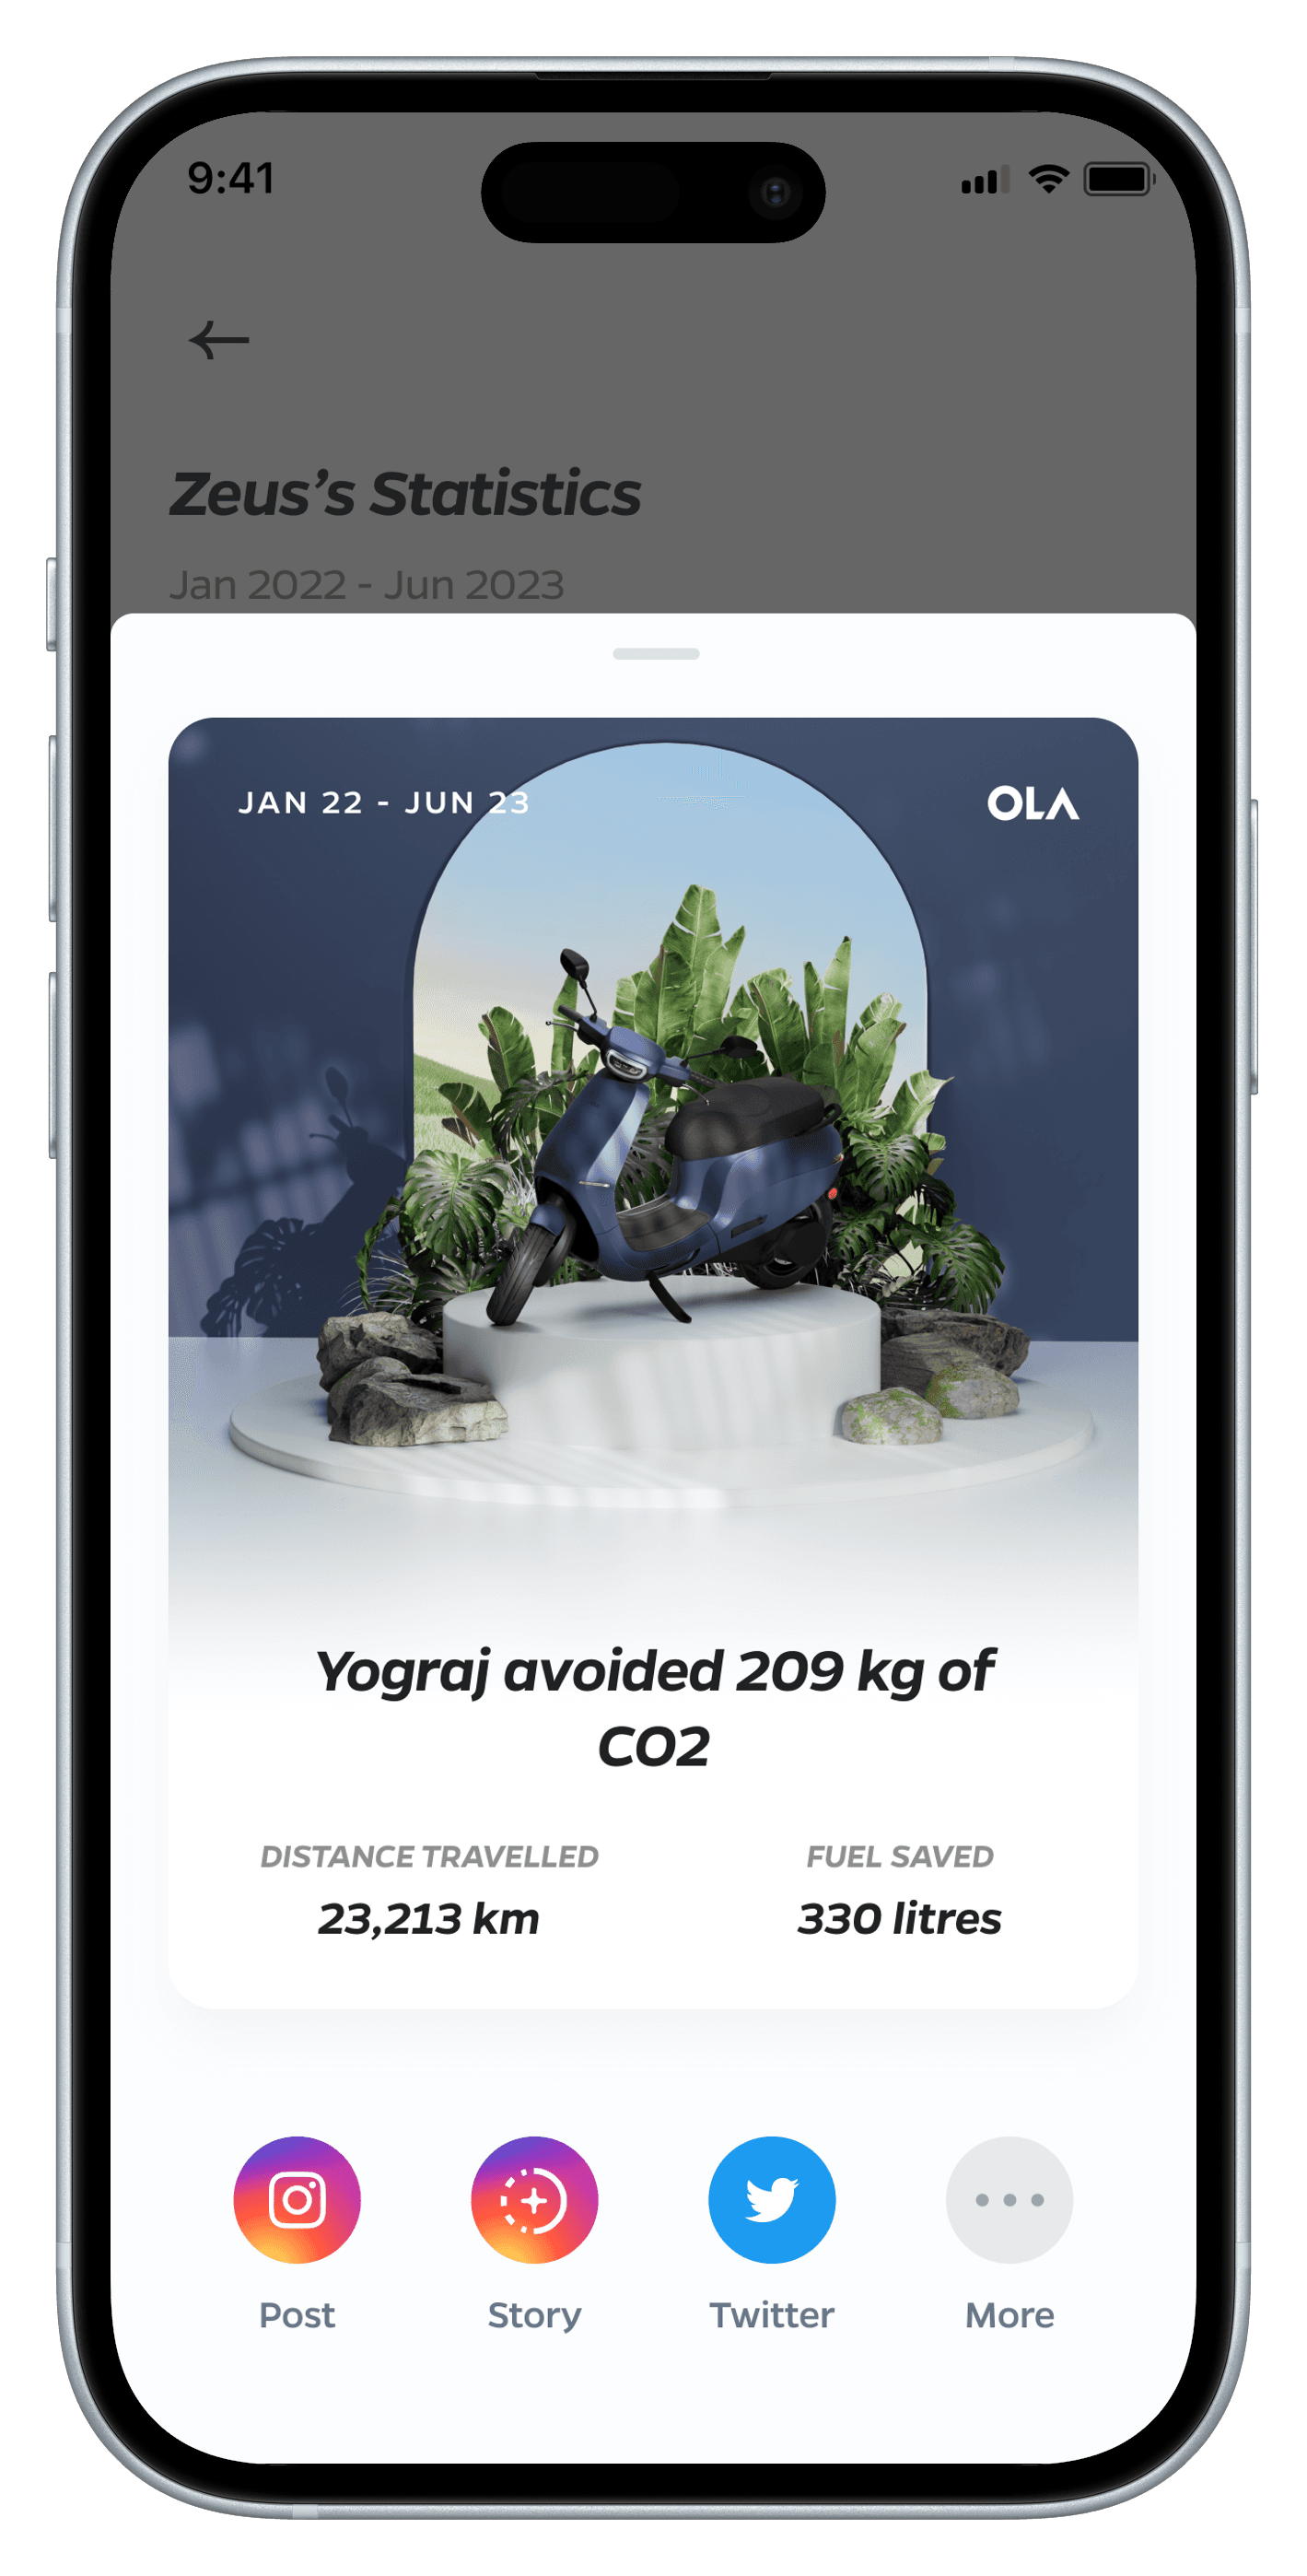
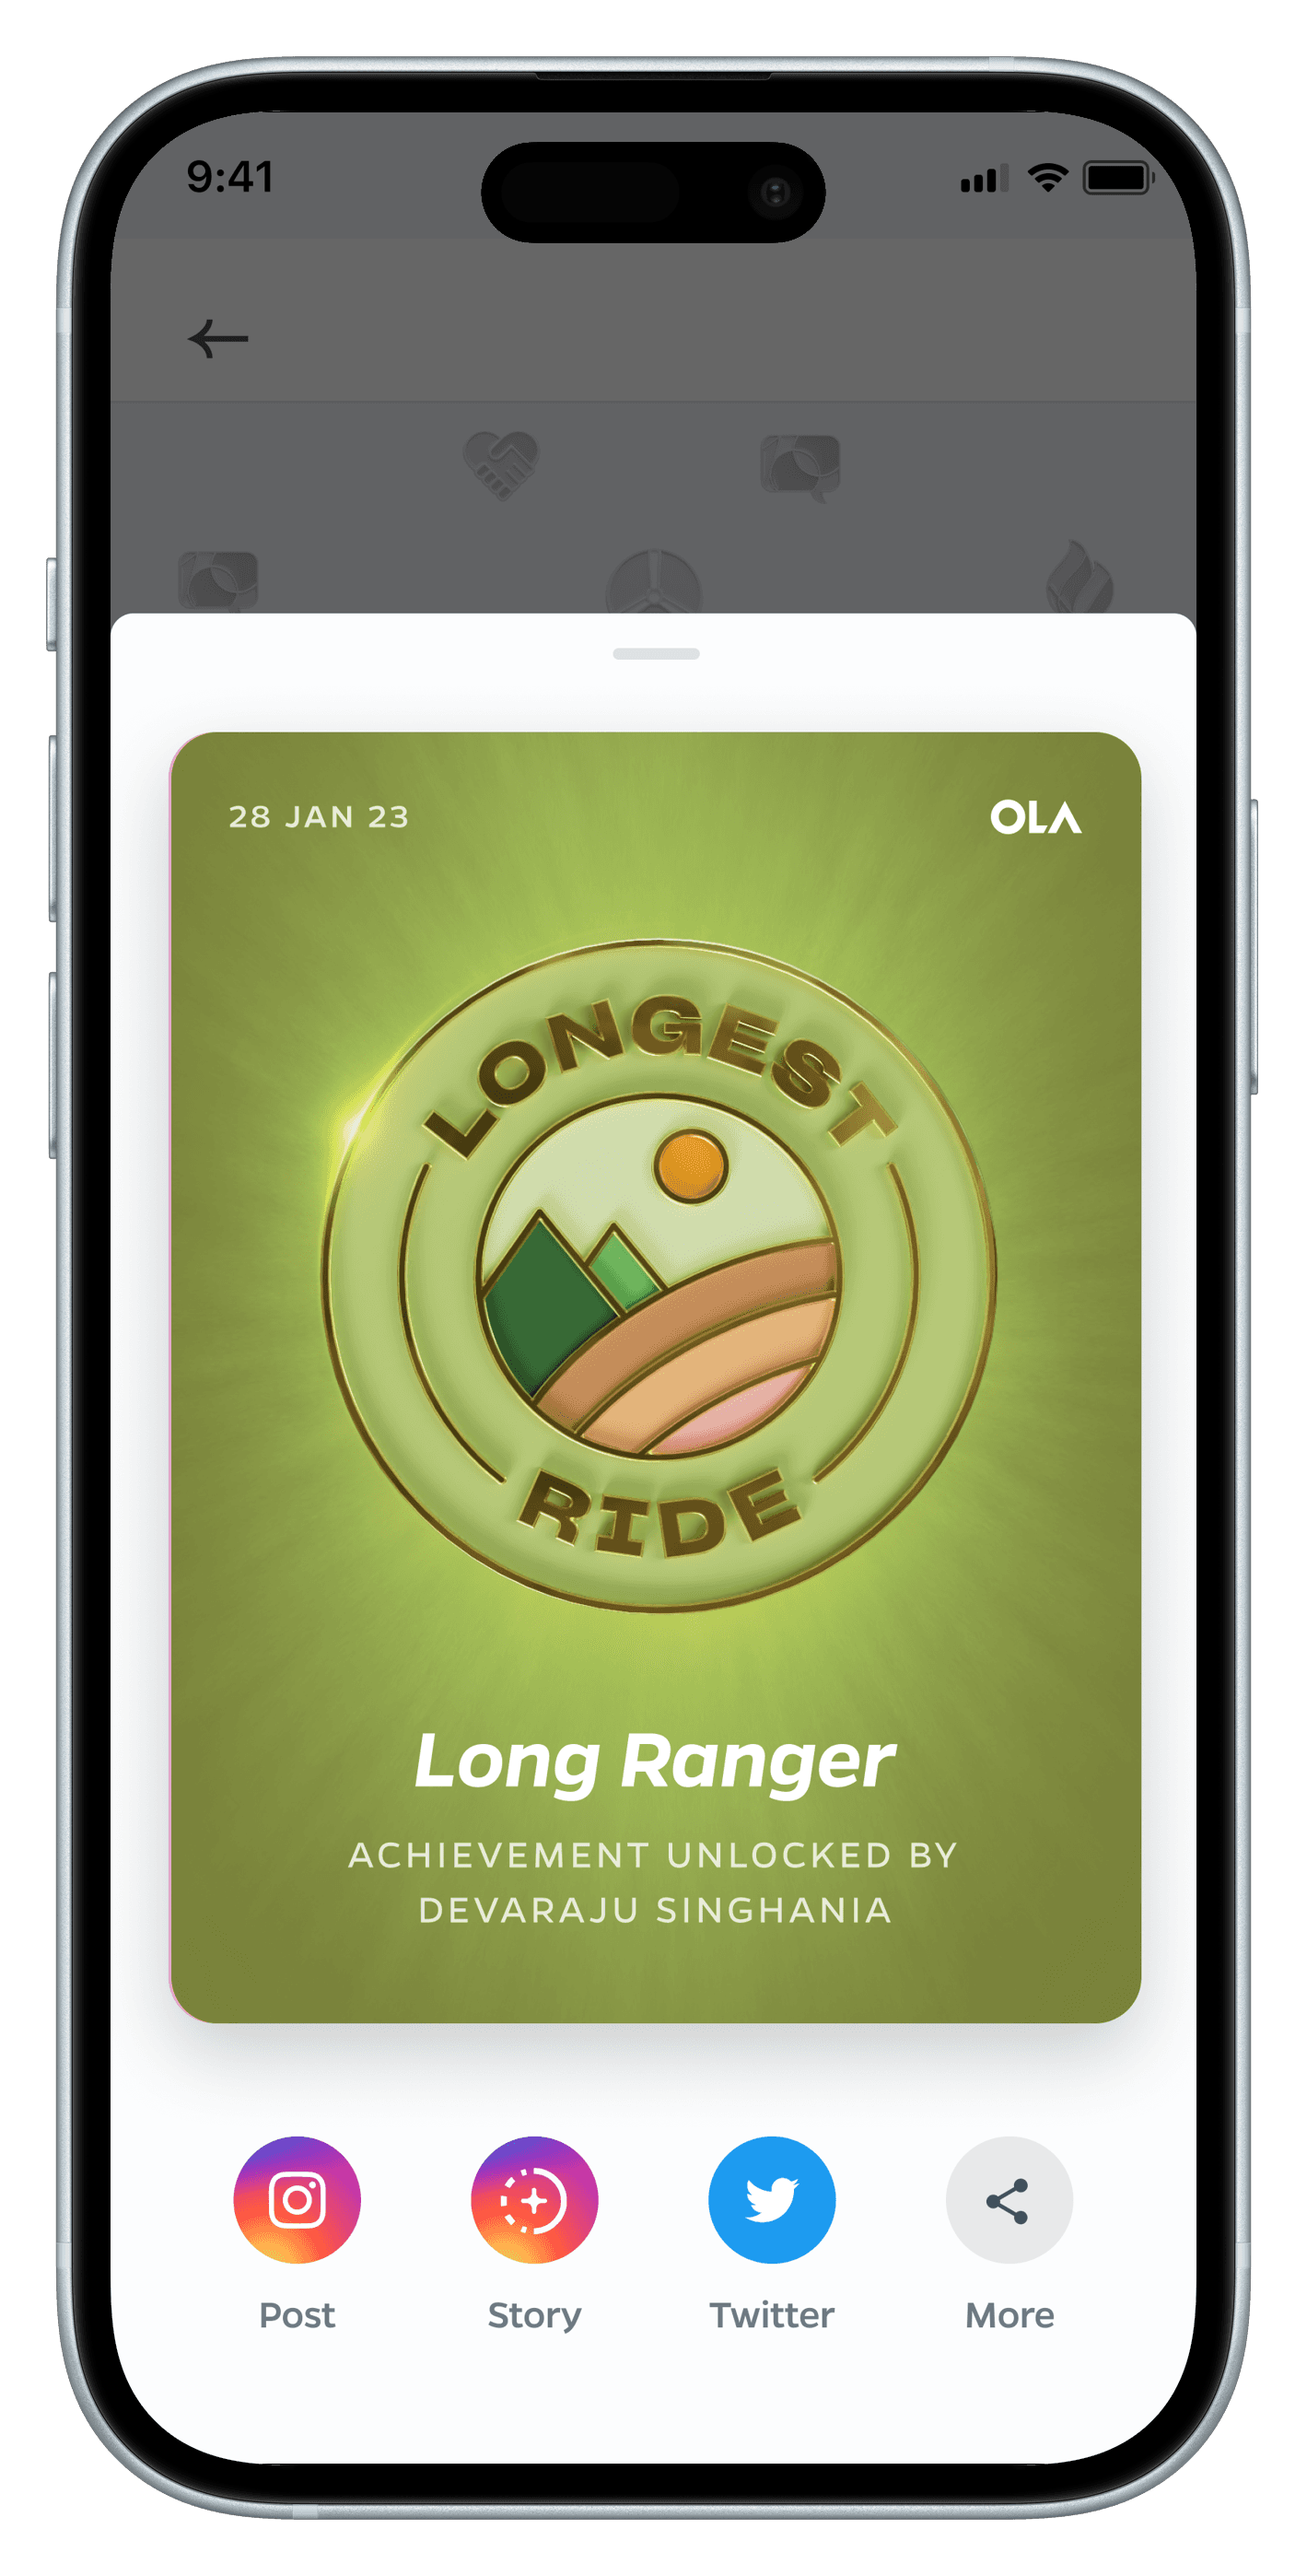
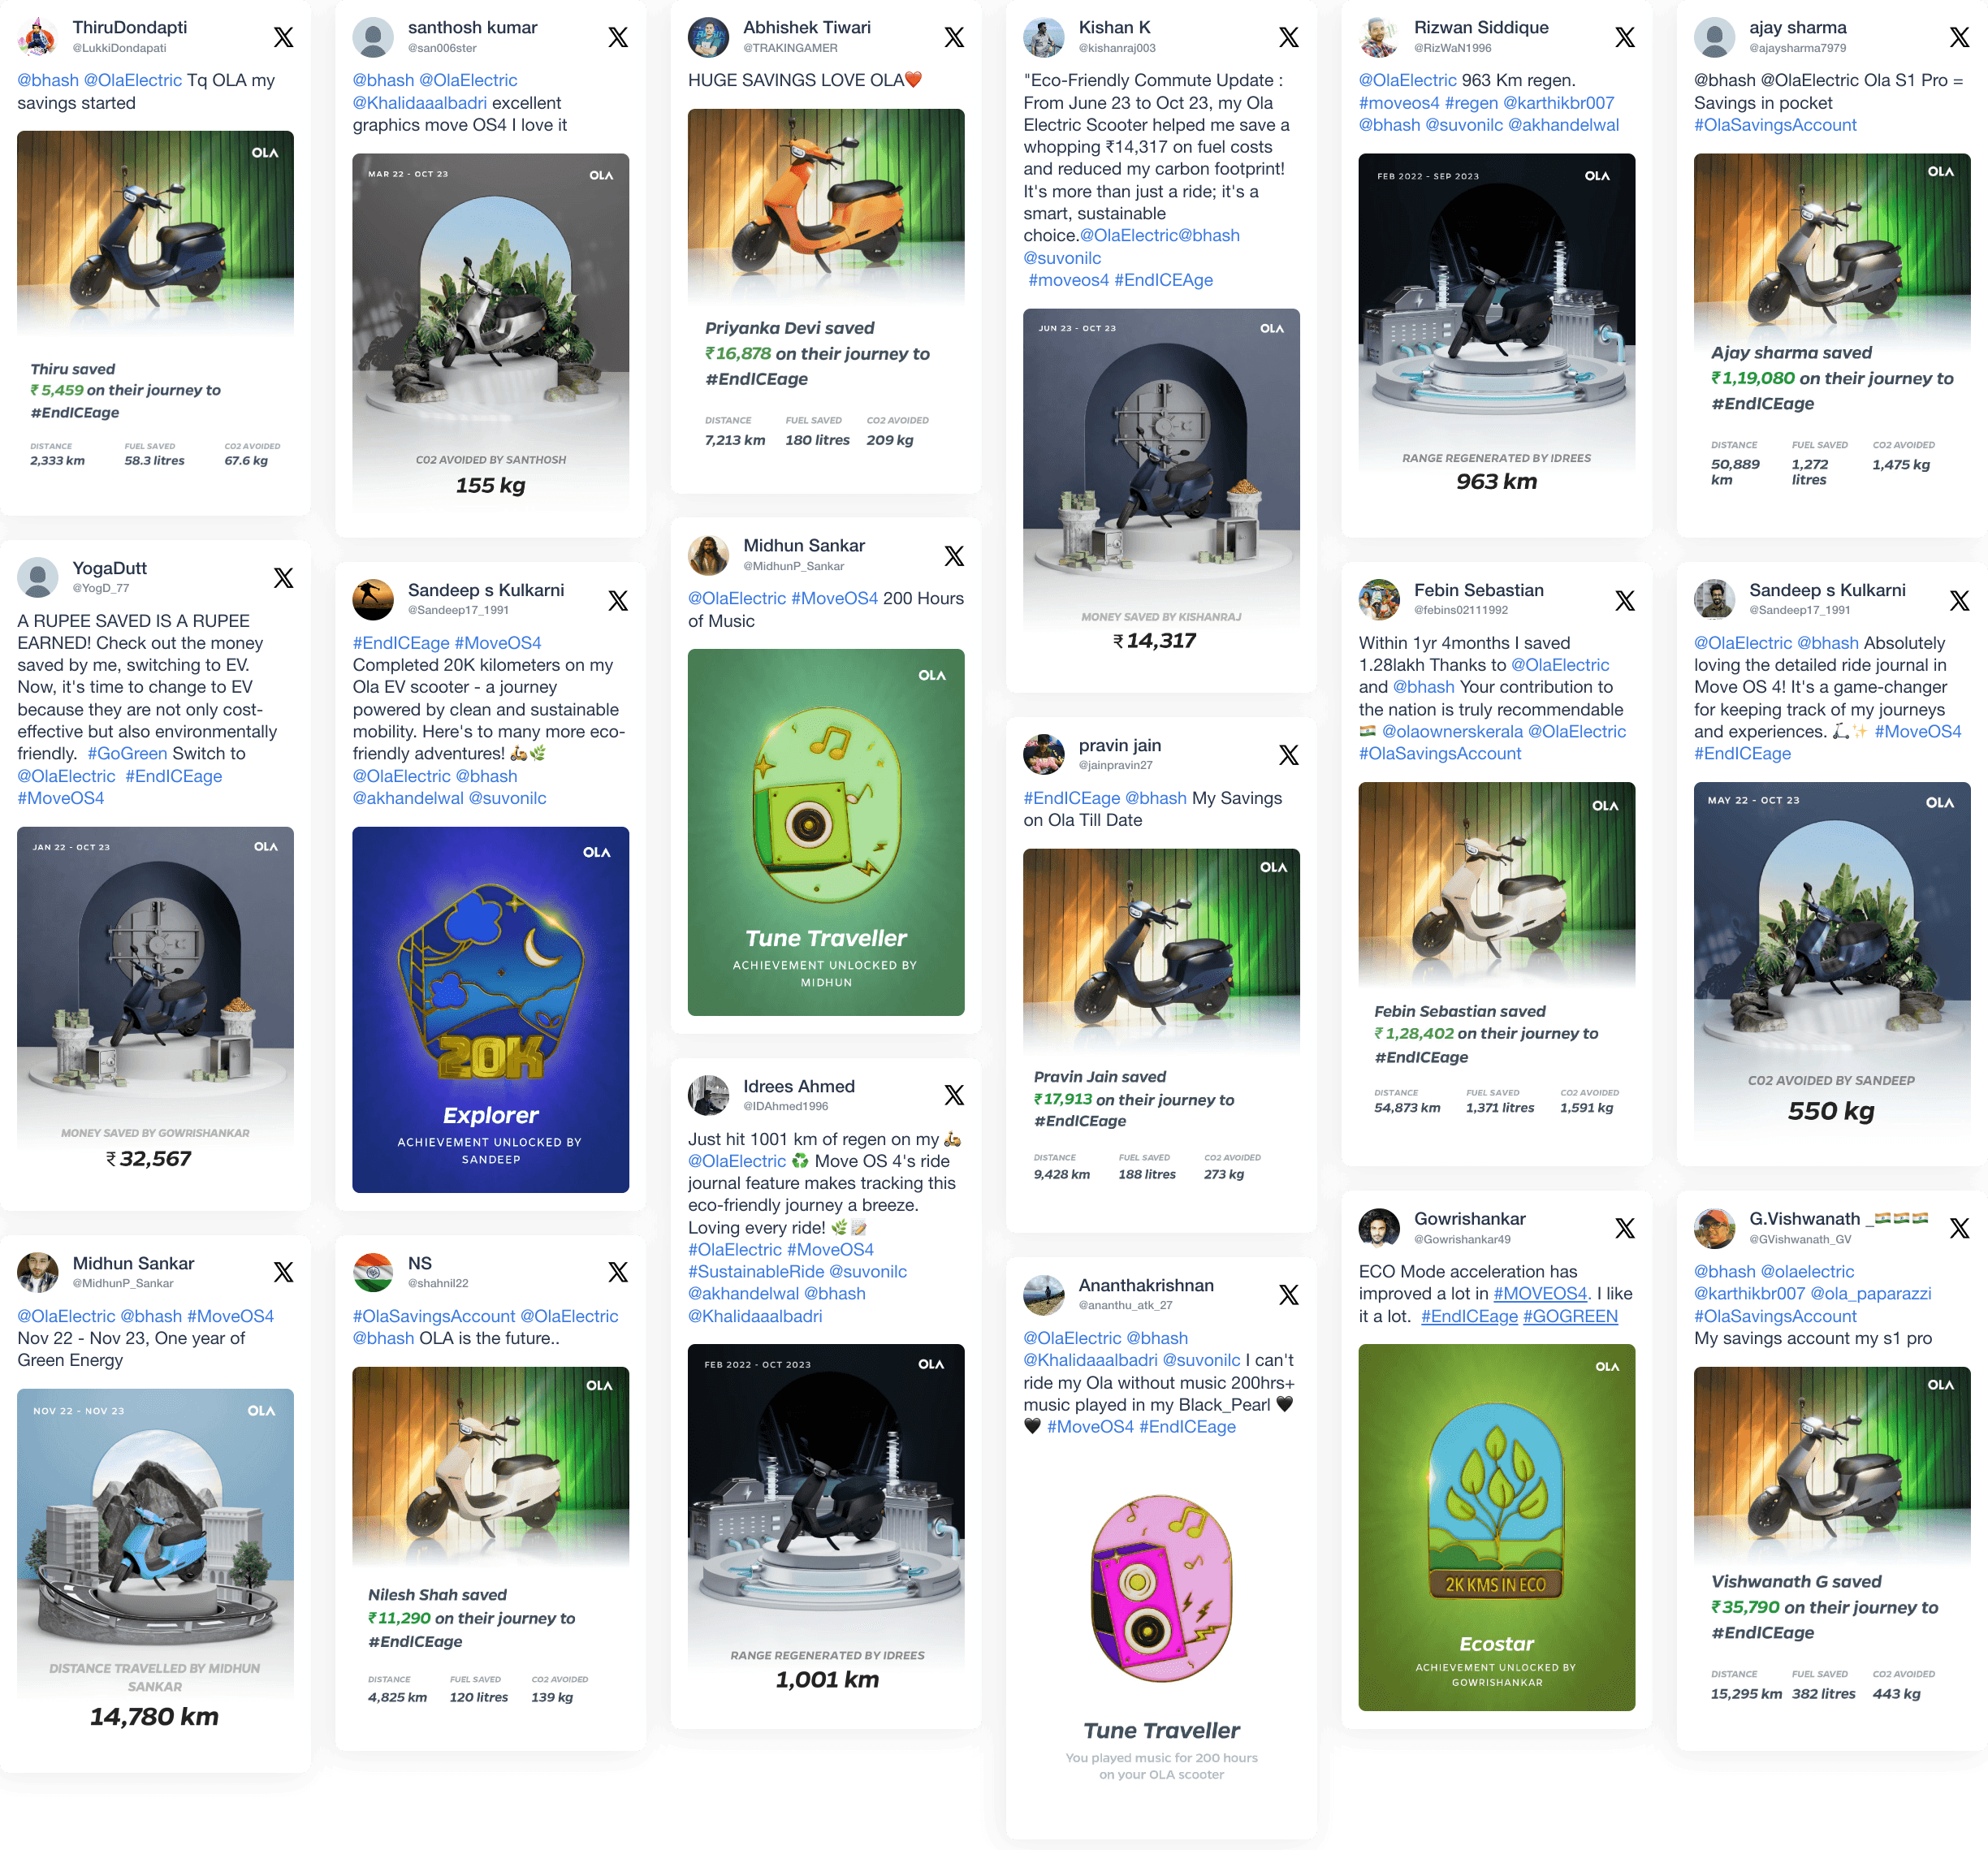
Shareable Feedcards
Shareable Feedcards
Customized, visually striking cards for social media sharing
One-tap sharing functionality to reduce friction
Highlight key stats: distance traveled, CO2 saved, money saved, unique achievements and badges earned
QR codes on shared images for easy app downloads by viewers
Customized, visually striking cards for social media sharing
One-tap sharing functionality to reduce friction
Highlight key stats: distance traveled, CO2 saved, money saved, unique achievements and badges earned
QR codes on shared images for easy app downloads by viewers
Customized, visually striking cards for social media sharing
One-tap sharing functionality to reduce friction
Highlight key stats: distance traveled, CO2 saved, money saved, unique achievements and badges earned
QR codes on shared images for easy app downloads by viewers
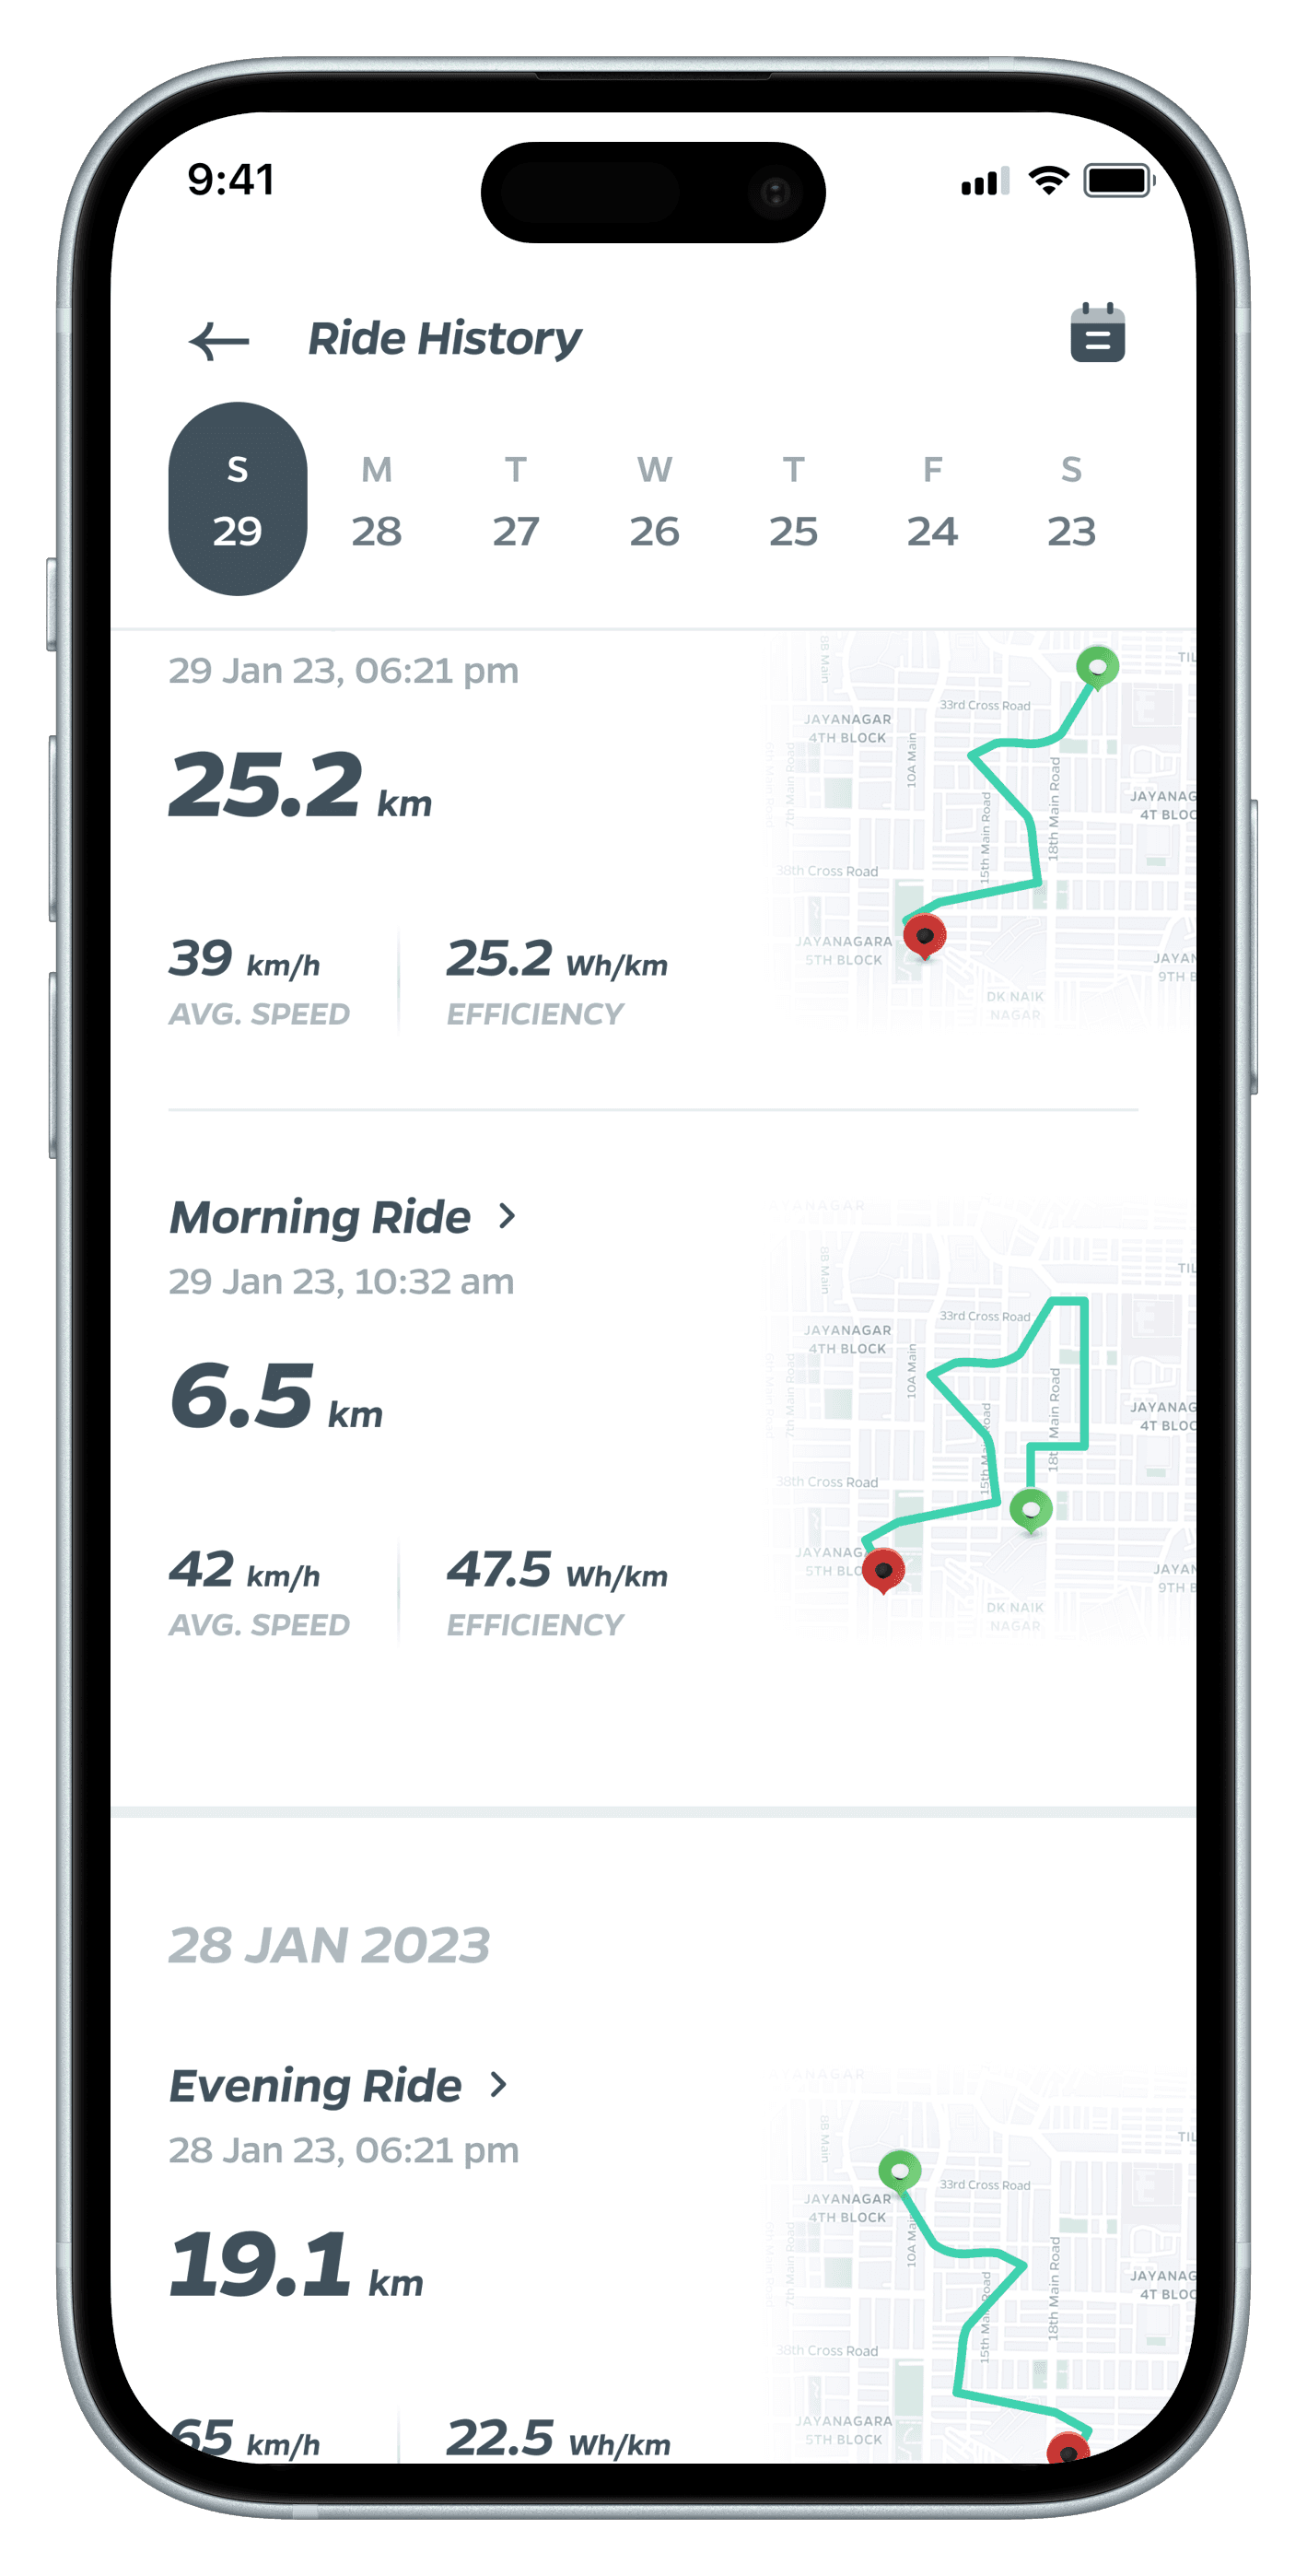
Ride History and Planning
Ride History and Planning
Calendar view of past rides with detailed metrics and route replay
Predictive analysis for future rides based on historical data
Suggested routes for achieving specific goals (e.g., maximizing range, charging)
Integration with weather forecasts for ride planning and mode recommendations
Calendar view of past rides with detailed metrics and route replay
Predictive analysis for future rides based on historical data
Suggested routes for achieving specific goals (e.g., maximizing range, charging)
Integration with weather forecasts for ride planning and mode recommendations
Calendar view of past rides with detailed metrics and route replay
Predictive analysis for future rides based on historical data
Suggested routes for achieving specific goals (e.g., maximizing range, charging)
Integration with weather forecasts for ride planning and mode recommendations
Badges 3D Design
Badges 3D Design


The Result
The Result
Shift in User Behaviour
Increased Feature Utilisation
Battery Optimisation
Conscious Riding Practises
Rider Communities
Data for Product Development
Organic Social Media Outreach
Brand Loyalty
Shift in User Behaviour
Shift in User Behaviour
Increased Feature Utilisation
Increased Feature Utilisation
Battery Optimisation
Battery Optimisation
Conscious Riding Practises
Conscious Riding Practises
Rider Communities
Rider Communities
Data for Product Development
Data for Product Development
Organic Social Media Outreach
Organic Social Media Outreach
Brand Loyalty
Brand Loyalty
The implementation of our ride analytics system yielded far-reaching benefits that extended beyond mere feature adoption. We observed a significant shift in user behaviour towards more efficient and environmentally conscious riding practices. The gamification elements fostered a vibrant community of Ola Electric enthusiasts, turning users into brand advocates. Most importantly, the data-driven insights generated by the system provided valuable feedback for Ola Electric's product development, creating a virtuous cycle of continuous improvement in both the scooters and the user experience.
The implementation of our ride analytics system yielded far-reaching benefits that extended beyond mere feature adoption. We observed a significant shift in user behaviour towards more efficient and environmentally conscious riding practices. The gamification elements fostered a vibrant community of Ola Electric enthusiasts, turning users into brand advocates. Most importantly, the data-driven insights generated by the system provided valuable feedback for Ola Electric's product development, creating a virtuous cycle of continuous improvement in both the scooters and the user experience.
The implementation of our ride analytics system yielded far-reaching benefits that extended beyond mere feature adoption. We observed a significant shift in user behaviour towards more efficient and environmentally conscious riding practices. The gamification elements fostered a vibrant community of Ola Electric enthusiasts, turning users into brand advocates. Most importantly, the data-driven insights generated by the system provided valuable feedback for Ola Electric's product development, creating a virtuous cycle of continuous improvement in both the scooters and the user experience.
Increased Feature Awareness
Increased Feature Awareness
45%
45%
45%
Feature usage in a month
Feature usage in a month
302%
302%
302%
User Engagement over 12 months
User Engagement over 12 months
Environment Awareness
Environment Awareness
32%
32%
32%
Increase in ecomode usage
Increase in ecomode usage
Gamification Success
Gamification Success
43%
43%
43%
Users exploring new features to earn new badges
Users exploring new features to earn new badges
Data Driven Improvements
Improved Energy Efficiency
Improved Energy Efficiency
27%
27%
27%
Improvement across user base
Improvement across user base
Optimized Charging Behaviour
Optimized Charging Behaviour
44%
44%
44%
Users adopted healthier charging habits
Users adopted healthier charging habits
Social Media Engagement
Social Media Engagement
207%
207%
207%
User generated content via shareable feedcards
User generated content via shareable feedcards
Data Driven Improvements
Data Driven Improvements
Increased Community Building
Increased Community Building
Customer Testimonials
Customer Testimonials
The Process
The Process
The process our design approach focused on understanding user behavior, creating meaningful engagement, and developing a system that would encourage feature discovery and sustainable riding practices.
The process our design approach focused on understanding user behavior, creating meaningful engagement, and developing a system that would encourage feature discovery and sustainable riding practices.
The process our design approach focused on understanding user behavior, creating meaningful engagement, and developing a system that would encourage feature discovery and sustainable riding practices.
Research & Discovery
Research & Discovery
Analyzed existing user behavior patterns and feature interaction data
Identified key barriers to feature adoption and understanding
Conducted user interviews across different rider segments
Created user journey maps to identify pain points and opportunities
Researched gamification best practices in automotive apps
Analyzed community engagement patterns in EV user groups
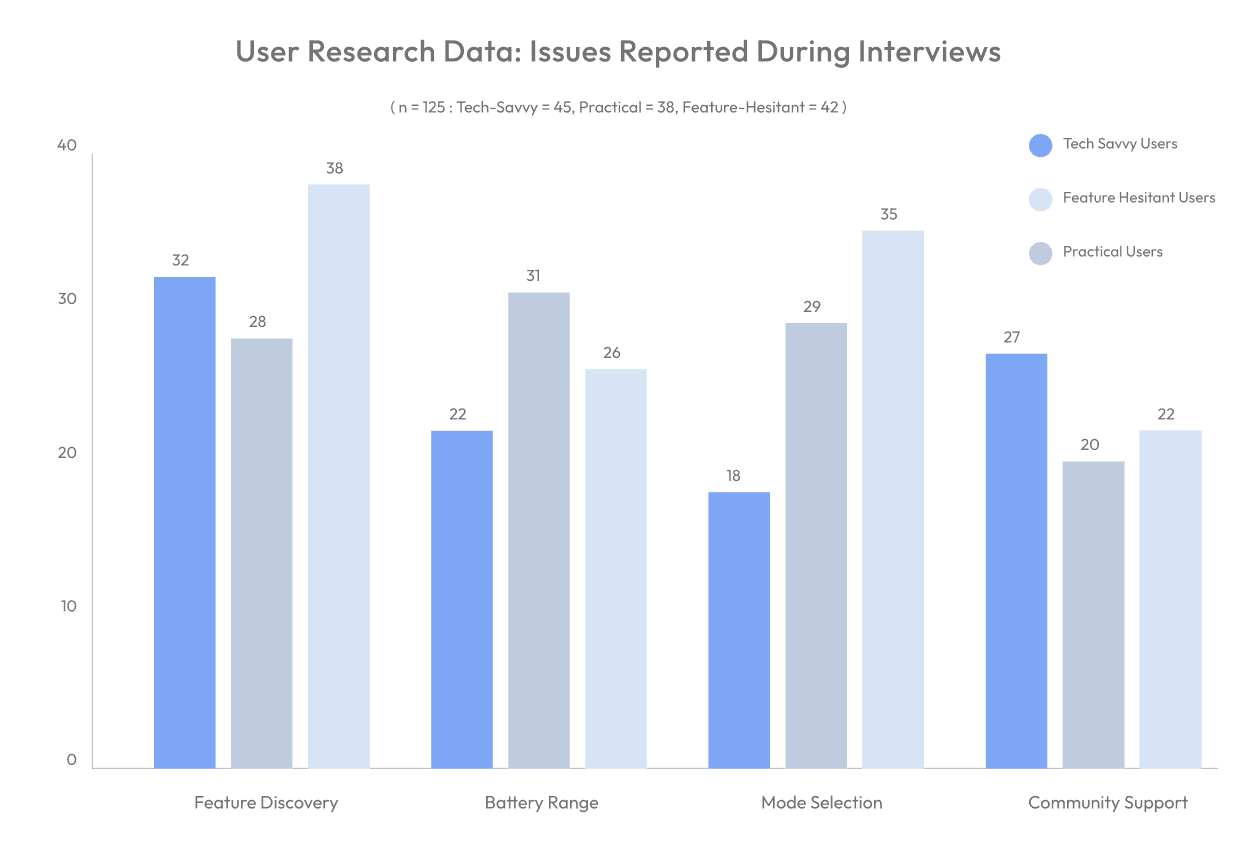
User Personas
User Personas
Tech-Savvy Urban Commuter
Tech-Savvy Urban Commuter
Pain Points
Pain Points
Wants to maximize scooter's efficiency
Struggles to track riding patterns
Unsure if using all features effectively
Seeks validation for eco-friendly choices
Wants to maximize scooter's efficiency
Struggles to track riding patterns
Unsure if using all features effectively
Seeks validation for eco-friendly choices
Wants to maximize scooter's efficiency
Struggles to track riding patterns
Unsure if using all features effectively
Seeks validation for eco-friendly choices
Goals
Goals
Optimize battery usage
Track cost savings
Share environmental impact
Master all scooter features
Optimize battery usage
Track cost savings
Share environmental impact
Master all scooter features
Optimize battery usage
Track cost savings
Share environmental impact
Master all scooter features
Practical Value Seeker
Practical Value Seeker
Pain Points
Pain Points
Concerned about battery life
Needs simple feature explanations
Wants to track expenses
Uncertain about riding modes
Concerned about battery life
Needs simple feature explanations
Wants to track expenses
Uncertain about riding modes
Concerned about battery life
Needs simple feature explanations
Wants to track expenses
Uncertain about riding modes
Goals
Goals
Save money on commute
Understand basic features
Maintain scooter health
Connect with other users
Save money on commute
Understand basic features
Maintain scooter health
Connect with other users
Save money on commute
Understand basic features
Maintain scooter health
Connect with other users
Feature-Hesitant Rider
Feature-Hesitant Rider
Pain Points
Pain Points
Concerned about battery life
Needs simple feature explanations
Wants to track expenses
Uncertain about riding modes
Concerned about battery life
Needs simple feature explanations
Wants to track expenses
Uncertain about riding modes
Concerned about battery life
Needs simple feature explanations
Wants to track expenses
Uncertain about riding modes
Goals
Goals
Understand basic features clearly
Track daily commute expenses
Connect with experienced riders
Maximize battery efficiency
Understand basic features clearly
Track daily commute expenses
Connect with experienced riders
Maximize battery efficiency
Understand basic features clearly
Track daily commute expenses
Connect with experienced riders
Maximize battery efficiency
User Stories & Scenarios
Community Engagement
“ I want to compare my stats”
Community Engagement
“ I want to compare my savings with my friends”
Community Engagement
“ I want to compare my stats”
Community Engagement
“I want to share my milestones"
Community Engagement
“I want to share my milestones"
Feature Discovery
"I want to discover advanced capabilities"
Feature Discovery
"I want to discover advanced capabilities"
Daily Commute Journey
“I want to understand which mode is best for my route”
Daily Commute Journey
“I want to understand which mode is best for my route”
Daily Commute Journey
“I want to understand which mode is best for my route”
Daily Commute Journey
“I want to optimize my energy usage”
Daily Commute Journey
“I want to optimize my energy usage”
Feature Discovery
"I want to discover advanced capabilities"
Feature Discovery
"I want to discover advanced capabilities"
Growth & Achievement
“I want to analyze my riding trends”
Growth & Achievement
“I want to analyze my riding trends”
Growth & Achievement
“I want to earn riding achievements”
Growth & Achievement
“I want to earn riding achievements”
Growth & Achievement
“I want to earn riding achievements”
Feature Discovery
“I want to understand each mode”
Feature Discovery
“I want to understand each mode”
Feature Discovery
“I want to understand each mode”
Community Engagement
“I want to share my milestones
Community Engagement
“I want to share my milestones"
Daily Commute Journey
“I want to track my savings and impact”
Daily Commute Journey
“I want to track my savings and impact”
Feature Discovery
“I want to learn features through guided experience”
Feature Discovery
“I want to learn features through guided experience”
Community Engagement
“I want to compare my stats”
Community Engagement
“I want to compare my stats”
Community Engagement
“I want to compare my stats”
Feature Discovery
“I want to learn features through guided experience”
Feature Discovery
“I want to learn features through guided experience”
Daily Commute Journey
“I want to track my savings”
Daily Commute Journey
“I want to track my savings”
Growth & Achievement
"I want to track my weekly ride metrics
Growth & Achievement
"I want to track my weekly ride metrics
Growth & Achievement
"I want to track my weekly ride metrics"
Design Iterations
Design Iterations
Achievement System
Achievement System
Badge-Centric
Badge-Centric
Large, detailed badges
Progress indicators
Category based
Unlock animations
Large, detailed badges
Progress indicators
Category based
Unlock animations
Large, detailed badges
Progress indicators
Category based
Unlock animations
Progress-Centric
Progress-Centric
Timeline view
Milestone markers
Achievement clusters
Social sharing focus
Timeline view
Milestone markers
Achievement clusters
Social sharing focus
Timeline view
Milestone markers
Achievement clusters
Social sharing focus
Story-Centric
Story-Centric
Journey narrative
Character progression
Quest-like structure
Guided discovery
Journey narrative
Character progression
Quest-like structure
Guided discovery
Journey narrative
Character progression
Quest-like structure
Guided discovery
Energy Insights
Energy Insights
Advanced Analytics
Advanced Analytics
Detailed graphs
Multiple metrics
Technical terms
Comparative analysis
Detailed graphs
Multiple metrics
Technical terms
Comparative analysis
Detailed graphs
Multiple metrics
Technical terms
Comparative analysis
Simplified Visual
Simplified Visual
Basic indicators
Color coding
Simple terminology
Quick tips
Basic indicators
Color coding
Simple terminology
Quick tips
Basic indicators
Color coding
Simple terminology
Quick tips
Hybrid Approach
Hybrid Approach
Expandable details
Interactive elements
Progressive disclosure
Contextual help
Expandable details
Interactive elements
Progressive disclosure
Contextual help
Expandable details
Interactive elements
Progressive disclosure
Contextual help
Ride Summary
Ride Summary
Map Focus
Map Focus
Large route display
Minimal stats
Location markers
Basic metrics
Large route display
Minimal stats
Location markers
Basic metrics
Large route display
Minimal stats
Location markers
Basic metrics
Stats Focus
Stats Focus
Detailed breakdown
Small map
Multiple charts
Comprehensive data
Detailed breakdown
Small map
Multiple charts
Comprehensive data
Detailed breakdown
Small map
Multiple charts
Comprehensive data
Balanced View
Balanced View
Split screen layout
Key metrics
Interactive map
Swipeable details
Split screen layout
Key metrics
Interactive map
Swipeable details
Split screen layout
Key metrics
Interactive map
Swipeable details
Design Decision Matrix
Design Decision Matrix
High Impact / Easy Implementation
High Impact / Easy Implementation
Basic achievement badges
Simple ride summaries
Energy consumption graph
Basic achievement badges
Simple ride summaries
Energy consumption graph
Basic achievement badges
Simple ride summaries
Energy consumption graph
Low Impact / Easy Implementation
Low Impact / Easy Implementation
Social sharing buttons
Basic profile customization
Simple notifications
Social sharing buttons
Basic profile customization
Simple notifications
Social sharing buttons
Basic profile customization
Simple notifications
High Impact / Complex Implementation
High Impact / Complex Implementation
Community leaderboards
Detailed ride analytics
Predictive insights
Community leaderboards
Detailed ride analytics
Predictive insights
Community leaderboards
Detailed ride analytics
Predictive insights
Low Impact / Complex Implementation
Low Impact / Complex Implementation
Advanced animations
Detailed weather integration
Complex achievements
Advanced animations
Detailed weather integration
Complex achievements
Advanced animations
Detailed weather integration
Complex achievements
Iteration Feedback Highlights
Iteration Feedback Highlights
Key User Feedback:
Key User Feedback:
"Want simpler way to share achievements"
"Need clearer progress indicators"
"Love comparing with community"
"Battery insights most valuable"
"Animations make it engaging"
"Want simpler way to share achievements"
"Need clearer progress indicators"
"Love comparing with community"
"Battery insights most valuable"
"Animations make it engaging"
"Want simpler way to share achievements"
"Need clearer progress indicators"
"Love comparing with community"
"Battery insights most valuable"
"Animations make it engaging"
Implementation Priorities:
Implementation Priorities:
Simplify sharing flow
Enhanced progress visualization
Community comparison features
Battery optimization tips
Meaningful animations
Simplify sharing flow
Enhanced progress visualization
Community comparison features
Battery optimization tips
Meaningful animations
Simplify sharing flow
Enhanced progress visualization
Community comparison features
Battery optimization tips
Meaningful animations
Final Design Direction
Final Design Direction
Based on user feedback and testing, we chose to pursue
Based on user feedback and testing, we chose to pursue
Based on user feedback and testing, we chose to pursue
Hybrid approach to data presentation
Hybrid approach to data presentation
Hybrid approach to data presentation
Progressive feature discovery
Progressive feature discovery
Progressive feature discovery
Contextual learning
Contextual learning
Contextual learning
Community-driven achievements
Community-driven achievements
Community-driven achievements
Simplified sharing mechanisms
Simplified sharing mechanisms
Simplified sharing mechanisms
This direction balances the needs of our users while maintaining engagement and usefulness for all user types.
This direction balances the needs of our users while maintaining engagement and usefulness for all user types.
This direction balances the needs of our users while maintaining engagement and usefulness for all user types.
connect.
Don’t be shy...say hi !
Always up for fun collaborations, gigs and meeting over a pint !
Usually in Mumbai or Bangalore.
Always up for fun collaborations, gigs and meeting over a pint !
Usually in Mumbai or Bangalore.
connect.
Don’t be shy...say hi !
Always up for fun collaborations, gigs and meeting over a pint !
Usually in Mumbai or Bangalore.